Google’s latest Chrome 129 update significantly enhances the DevTools Performance panel, making Core Web Vitals optimization easier and more actionable. Let’s explore some of the standout features:
Track Your Performance Live
Real-Time Metrics
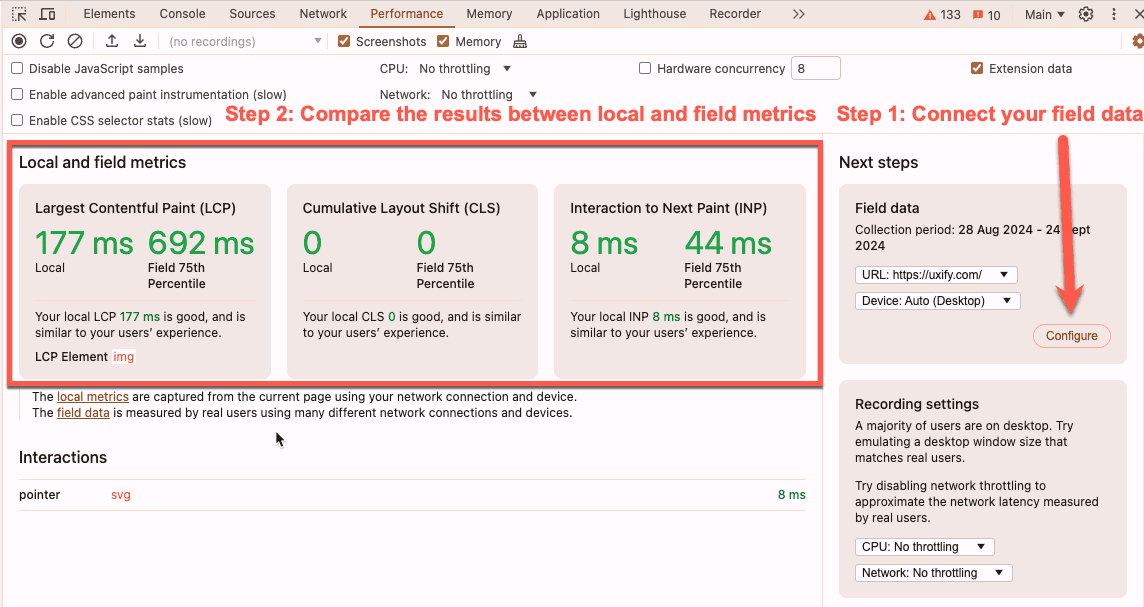
The Performance panel now provides a live view of Core Web Vitals (LCP, CLS, and INP) as you interact with a page, offering an immediate understanding of your site's performance. This eliminates the need for full performance recordings to identify potential issues. This serves as a handy substitute for the existing Web Vitals extension.
Field Data Integration
Compare your local performance data with real-world user experiences from the Chrome User Experience Report (CrUX), providing valuable context on how your optimizations impact user satisfaction.
To get the most out of the live performance tracker, remember to set up your field data in the Field data box.
This section helps you spot performance issues in LCP and CLS. Note that the INP value is recorded only when a user acts on the page.
Enhanced LCP Insights
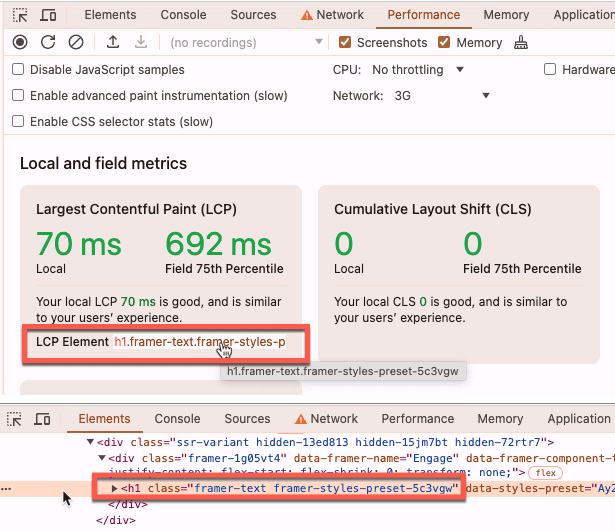
The tracker highlights the LCP element of your site, allowing you to quickly find and inspect its performance.
Actionable Recommendations
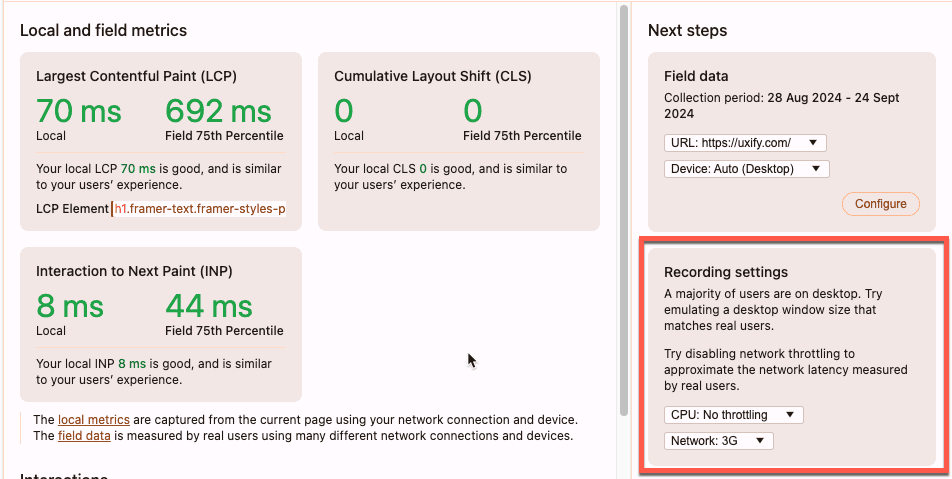
For more extensive testing under different conditions, you can use the Recording settings to choose the Network type and CPU throttling, simulating various connection speeds.
DevTools now suggests specific configurations for your local environment (device type, network throttling, and CPU throttling) to better mirror real-user conditions and help reproduce and resolve issues.
This update is part of a broader strategy to end support for the Web Vitals extension by January 7, 2025, so expect additional improvements in upcoming releases.
Other Notable Performance Panel Improvements
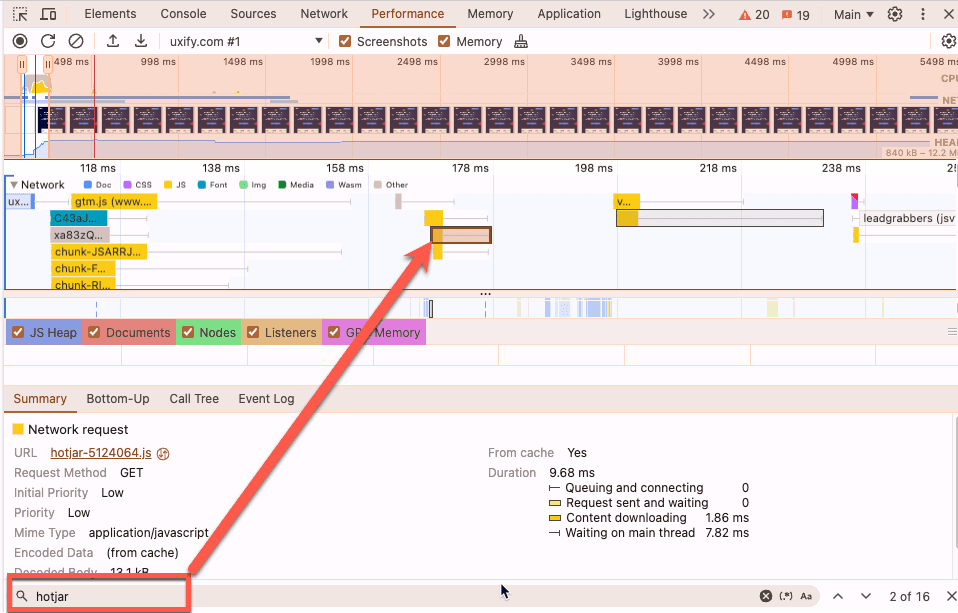
Network track search: Quickly locate specific network requests within the Performance panel using the new search functionality.
Custom Performance Data: Extend the performance trace with custom data using performance.mark and performance.measure, providing even more insights for complex applications.
Beyond the Performance Panel
Lighthouse 12.2.0: This update includes numerous improvements and fixes, further enhancing the reliability of your performance tracking.
scheduler.yield() for Long Tasks: In an ongoing effort to improve INP and make the user experience smoother, the Chrome 129 update comes with scheduler.yield() functionality.
What is the function of the scheduler.yield()?
Scheduler.yield() tells the browser to break long tasks into smaller chunks by yielding back to the main thread. This gives the main thread time to carry out more essential tasks, like responding to user input or painting a frame, while still executing the long task at hand.
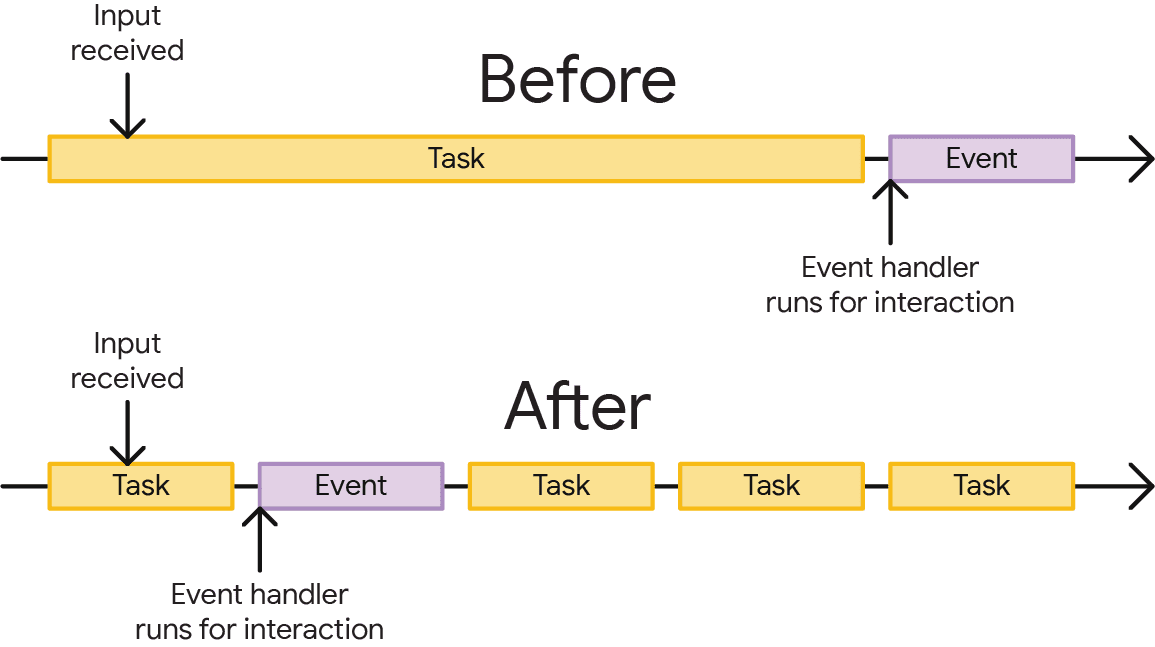
If you notice you have long tasks that block the main thread and lead to increased INP and perceived sluggishness on your site, simply add the following line into your JavaScript code:
Remember that using scheduler.yield() should not be the cure for all problems and should be used sparingly.
Conclusion
Chrome 129 introduces a wealth of performance optimization tools directly within the Performance panel, streamlining the Core Web Vitals optimization process and helping developers deliver faster, more user-friendly websites.
For in-depth information and tips on leveraging these updates, we recommend exploring the official Chrome developer documentation and related blog posts.

