Chrome 131 is here, offering exciting new features for both everyday users and developers alike. Beyond convenient tools like chatting with Gemini directly from the browser tab or using Google Lens to search by image, this update brings valuable improvements for developers and web performance enthusiasts. Here’s a look at what’s new:
Performance panel improvements
The Performance panel continues to get better and more versatile with each Chrome release, providing a robust tool not only for monitoring overall site performance but also for identifying and troubleshooting issues—all in one place.
Annotate and share performance findings
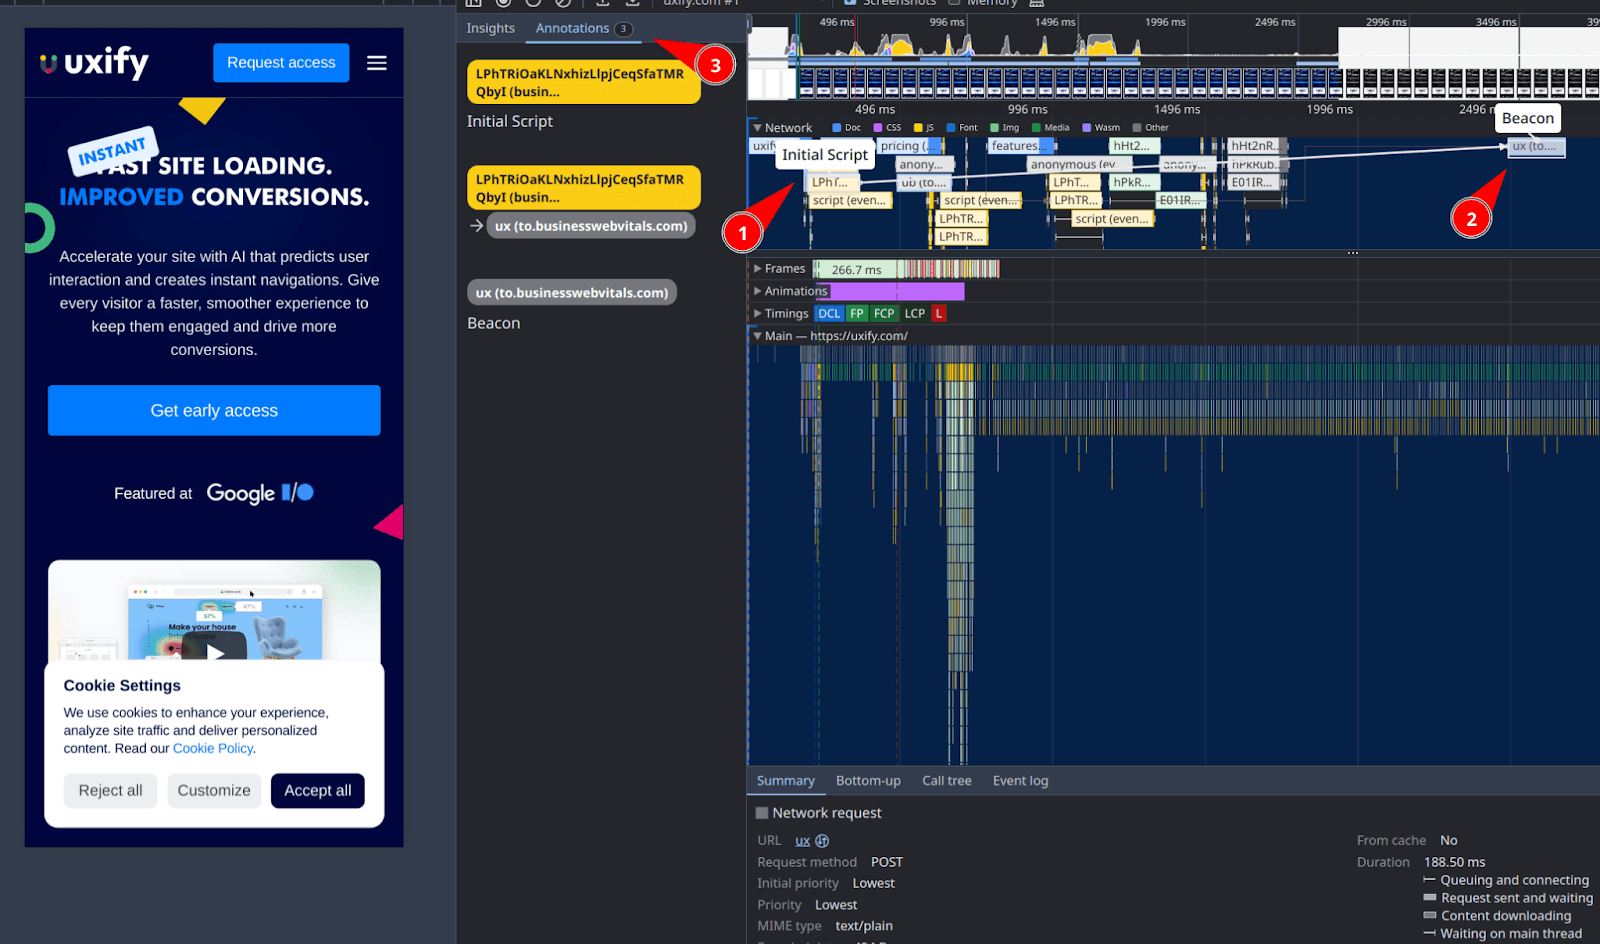
The Performance Panel now features an Annotations tab - an expandable sidebar for taking notes, making it easier to identify and share performance insights. In the new tab, you can highlight time ranges on the trace, use arrows to link events, add labels and comments, and then save and share these with your team. To label or connect elements, simply right-click on an item or double-click the event for quick access.
In the Annotations section, you can also right-click to save or load an annotation profile.
Enhanced Performance Insights
Chrome 131 introduces changes to Performance Insights. The previously separate Performance Insights panel is set to be deprecated, with its functionality now integrated into the "Insights" tab on the left sidebar of the Performance panel.

The new Insights report categorizes issues by the metric they impact, providing detailed information on the performance challenges you’re facing and actionable recommendations for resolving them. Highlighted elements help pinpoint exactly where improvements are needed.
Updates in the Layout shifts
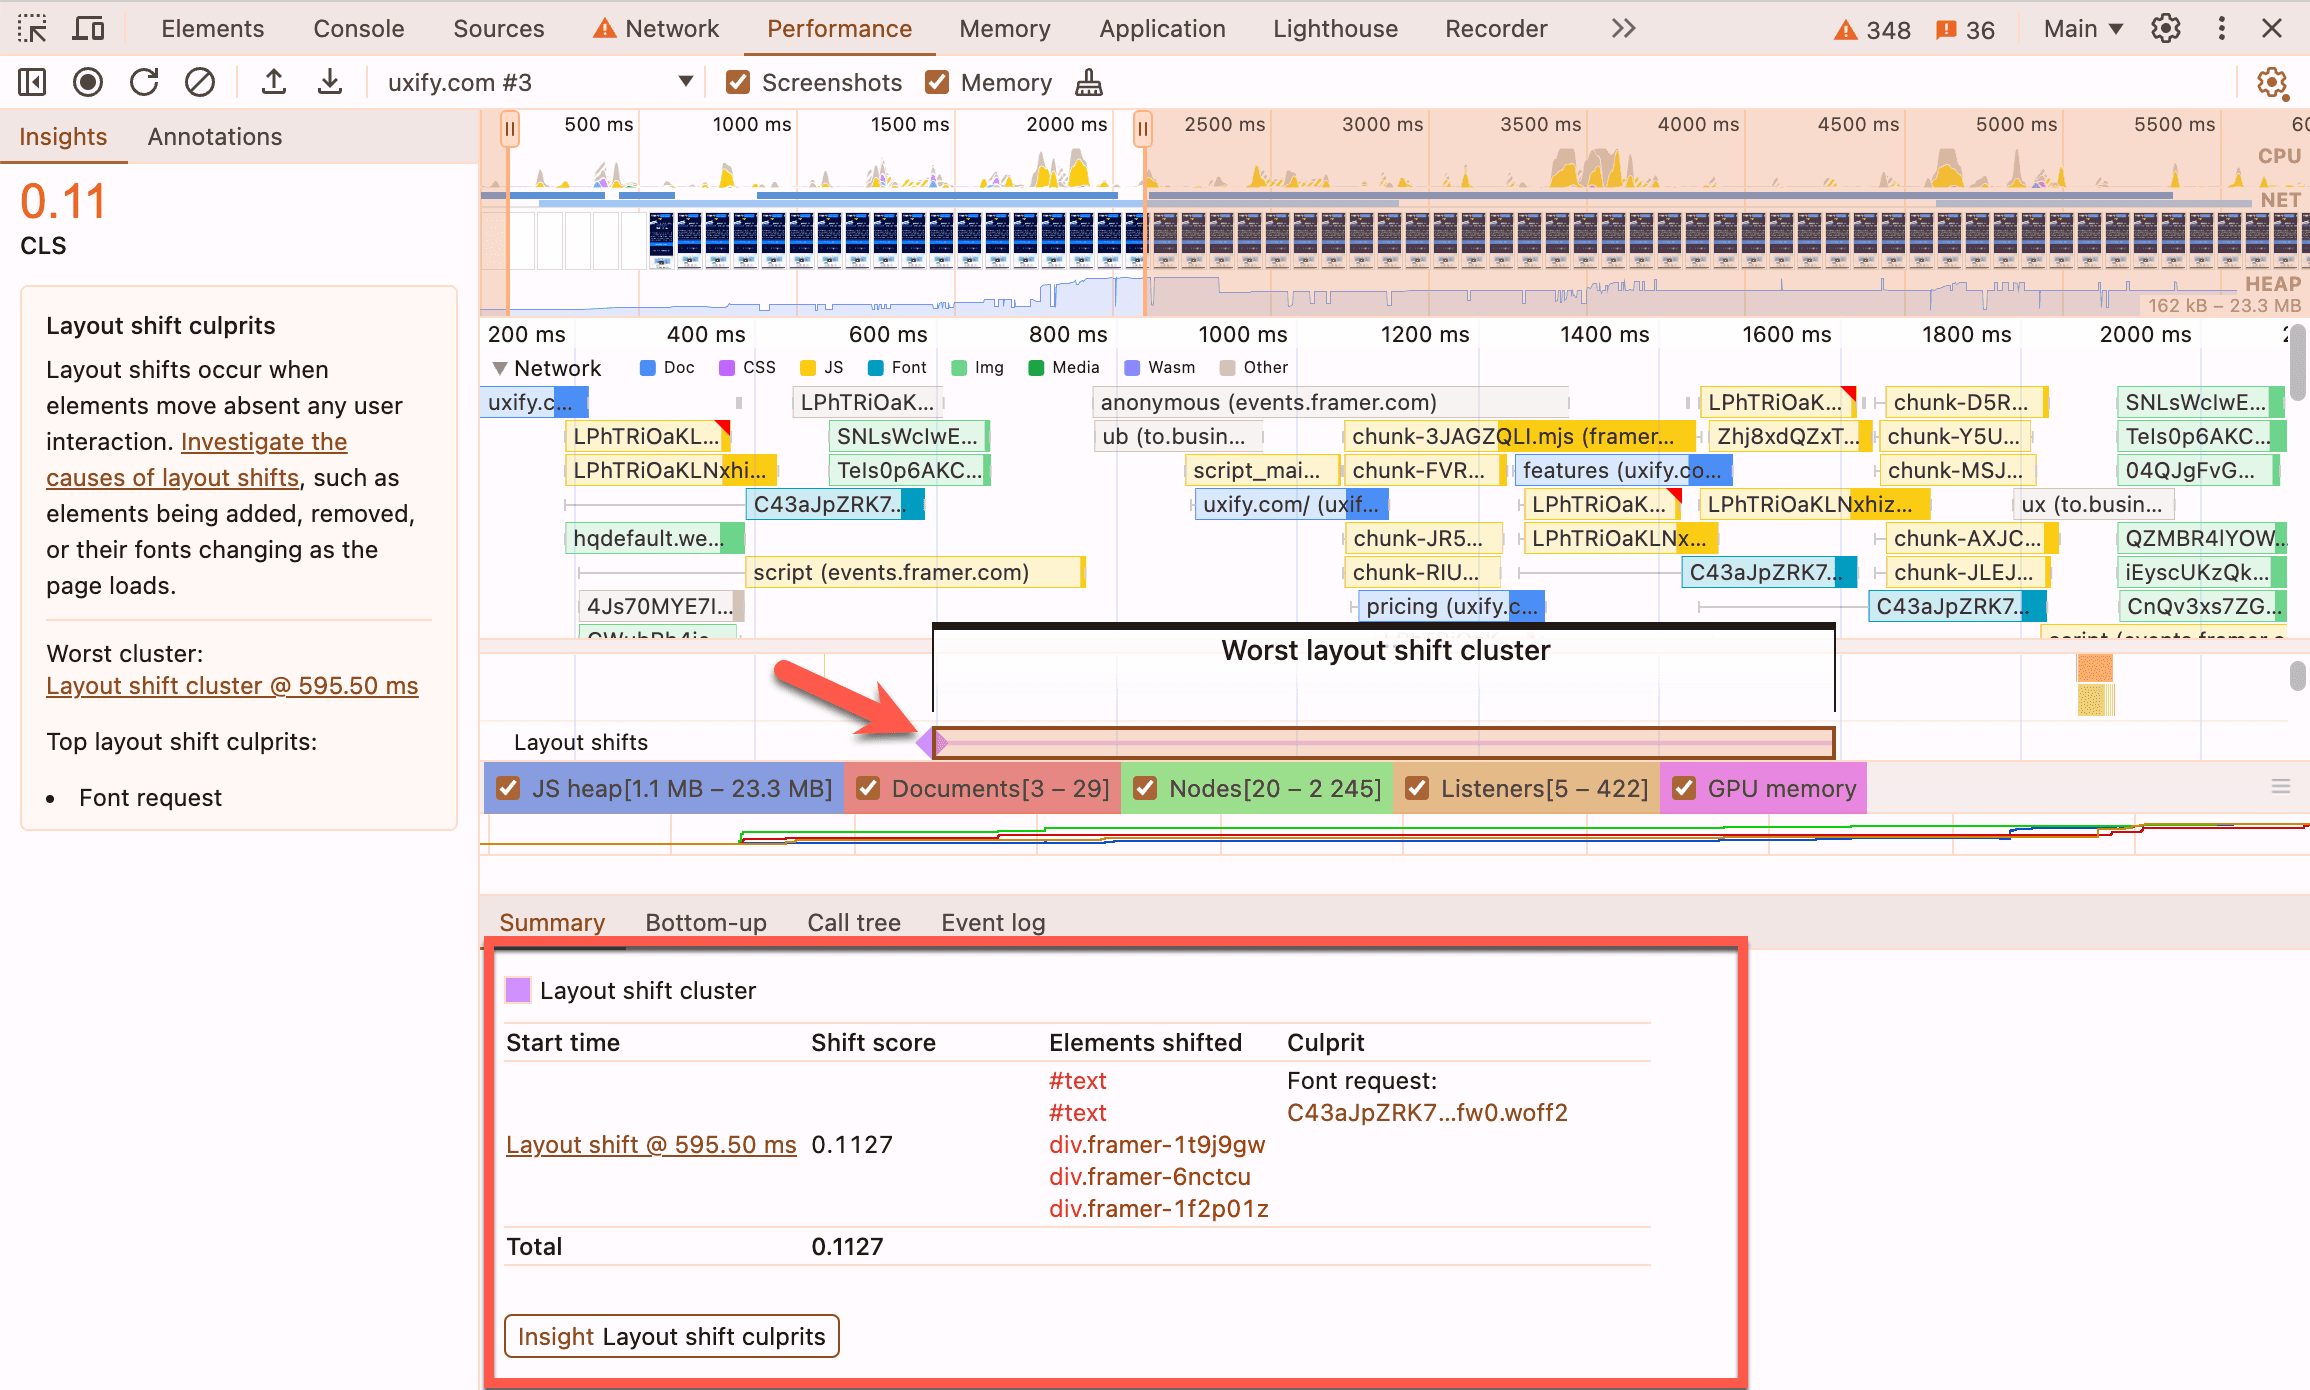
Layout shifts are now marked with purple diamonds and grouped in clusters on the timeline based on their proximity. Hovering on one of the diamonds presents an animation of the layout shift, allowing developers to directly see the shift as it occurred on the page. The diamonds are sized differently depending on their score.
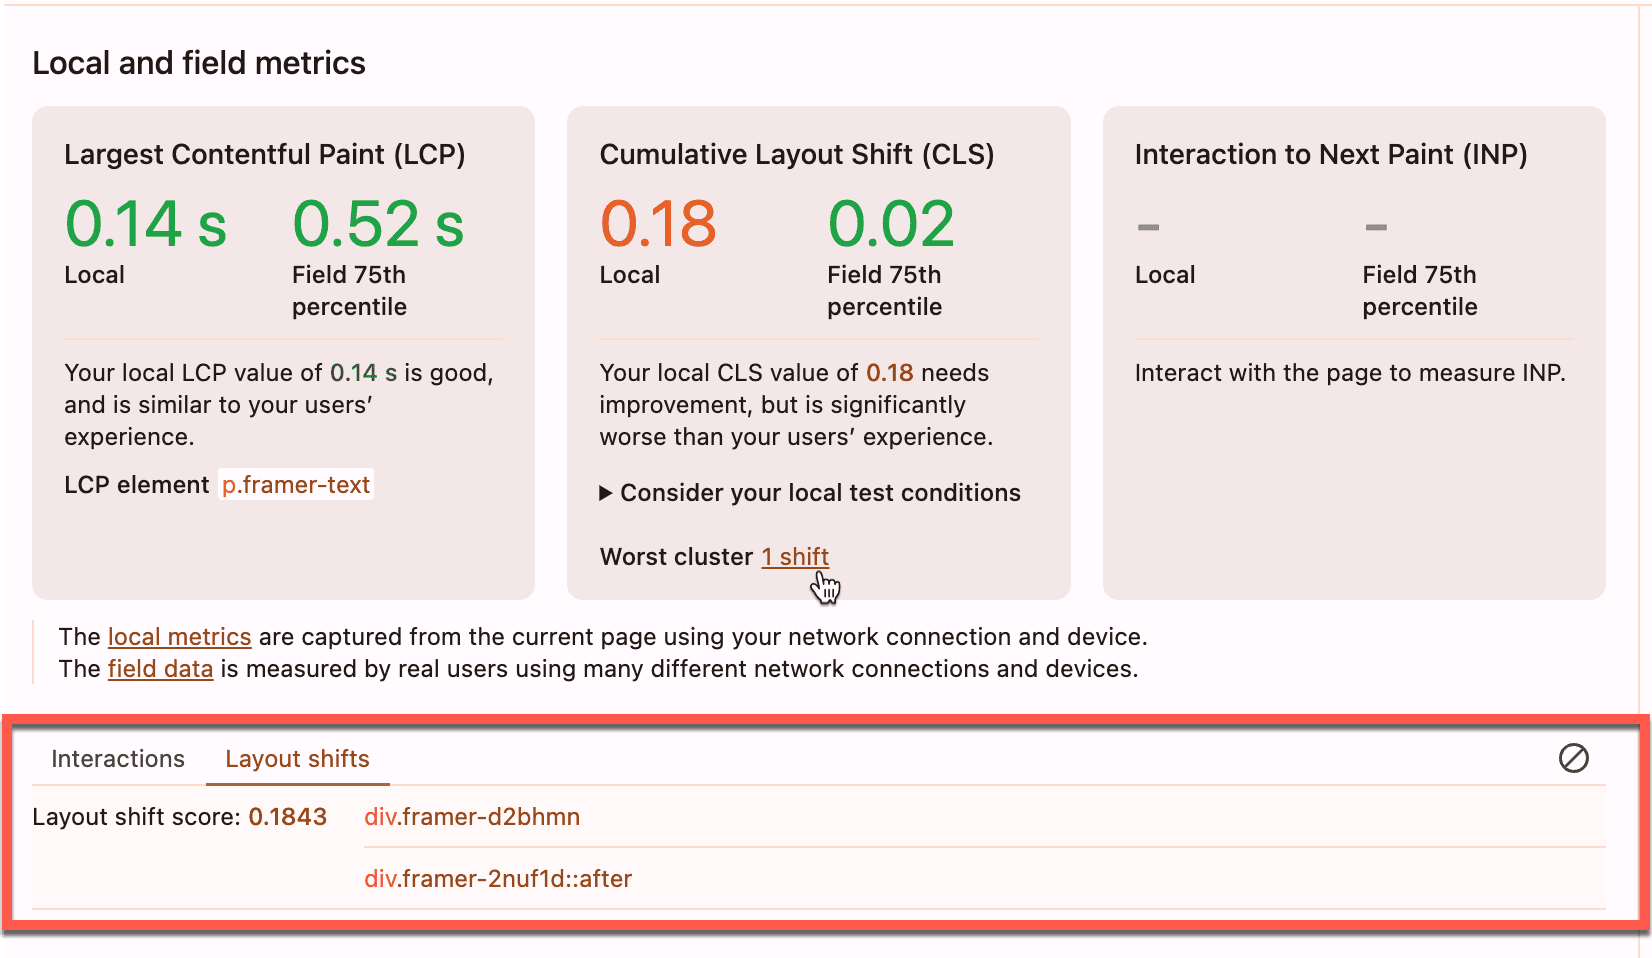
You can also view layout shifts under the Local and field metrics section next to the Interactions section:
Additional improvements
Improvements in the Animations track: The Animations track now marks non-composited animations with red triangles and labels them according to their associated CSS properties for easier tracking and visibility. Summary tab also includes insights into the causes of compositing failures.
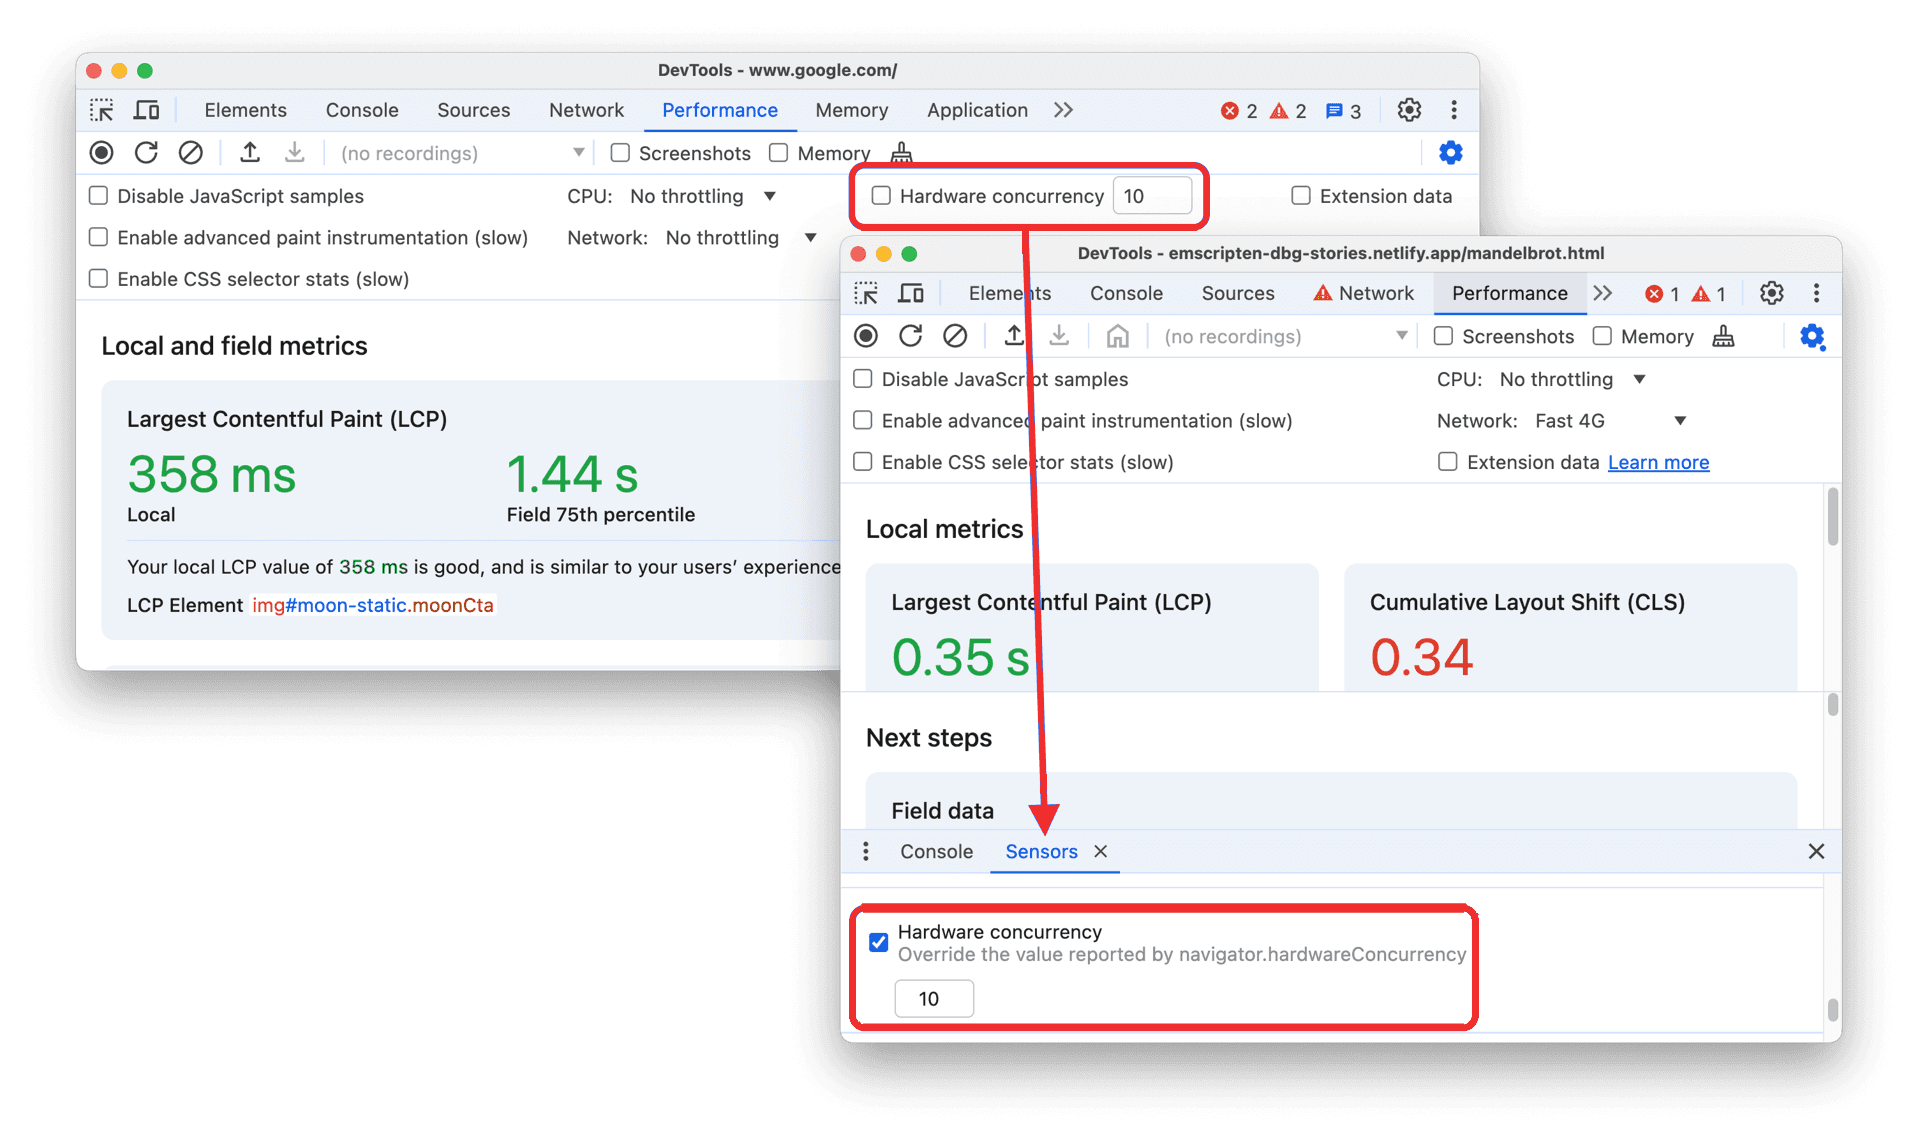
Hardware concurrency is now in the Sensors tab instead of the general Performance panel settings.
Chrome for Developers, What's new in DevTools, Chrome 131
Additional performance updates:
The Core Web Vitals overlay has been removed from the Rendering tab.
Throttling settings now synchronize between the Performance and Network panels.
The Performance panel reports incrementally progress when loading and processing traces.
AI assistance panel
Gemini, Google’s AI, is now integrated into Chrome DevTools. The AI assistance panel allows you to interact directly with AI to debug issues or gain a better understanding of your site’s code. Because each prompt is contextual, you get insights tailored to the specific page and its technical details.
This AI panel is particularly helpful for understanding the styles on a site. You can ask questions about elements in the DOM, how they interact, or why they are displayed in a certain way, which is especially useful for debugging styling issues.
Further AI assistance features are still in the experimental phase and will be introduced with Chrome 132. With these new tools, you’ll gain deeper insights into network requests on your site—including their origins, purposes, and overall impact on performance. Additionally, you’ll soon be able to ask questions about the files loaded on your site or a specific page for more targeted analysis. AI Assistance will be introduced in the Performance panel as well.
The AI assistance panel is currently experimental and available in Chrome Canary 131 onwards. Be sure to review the requirements before getting started.
How to activate the AI assistance panel
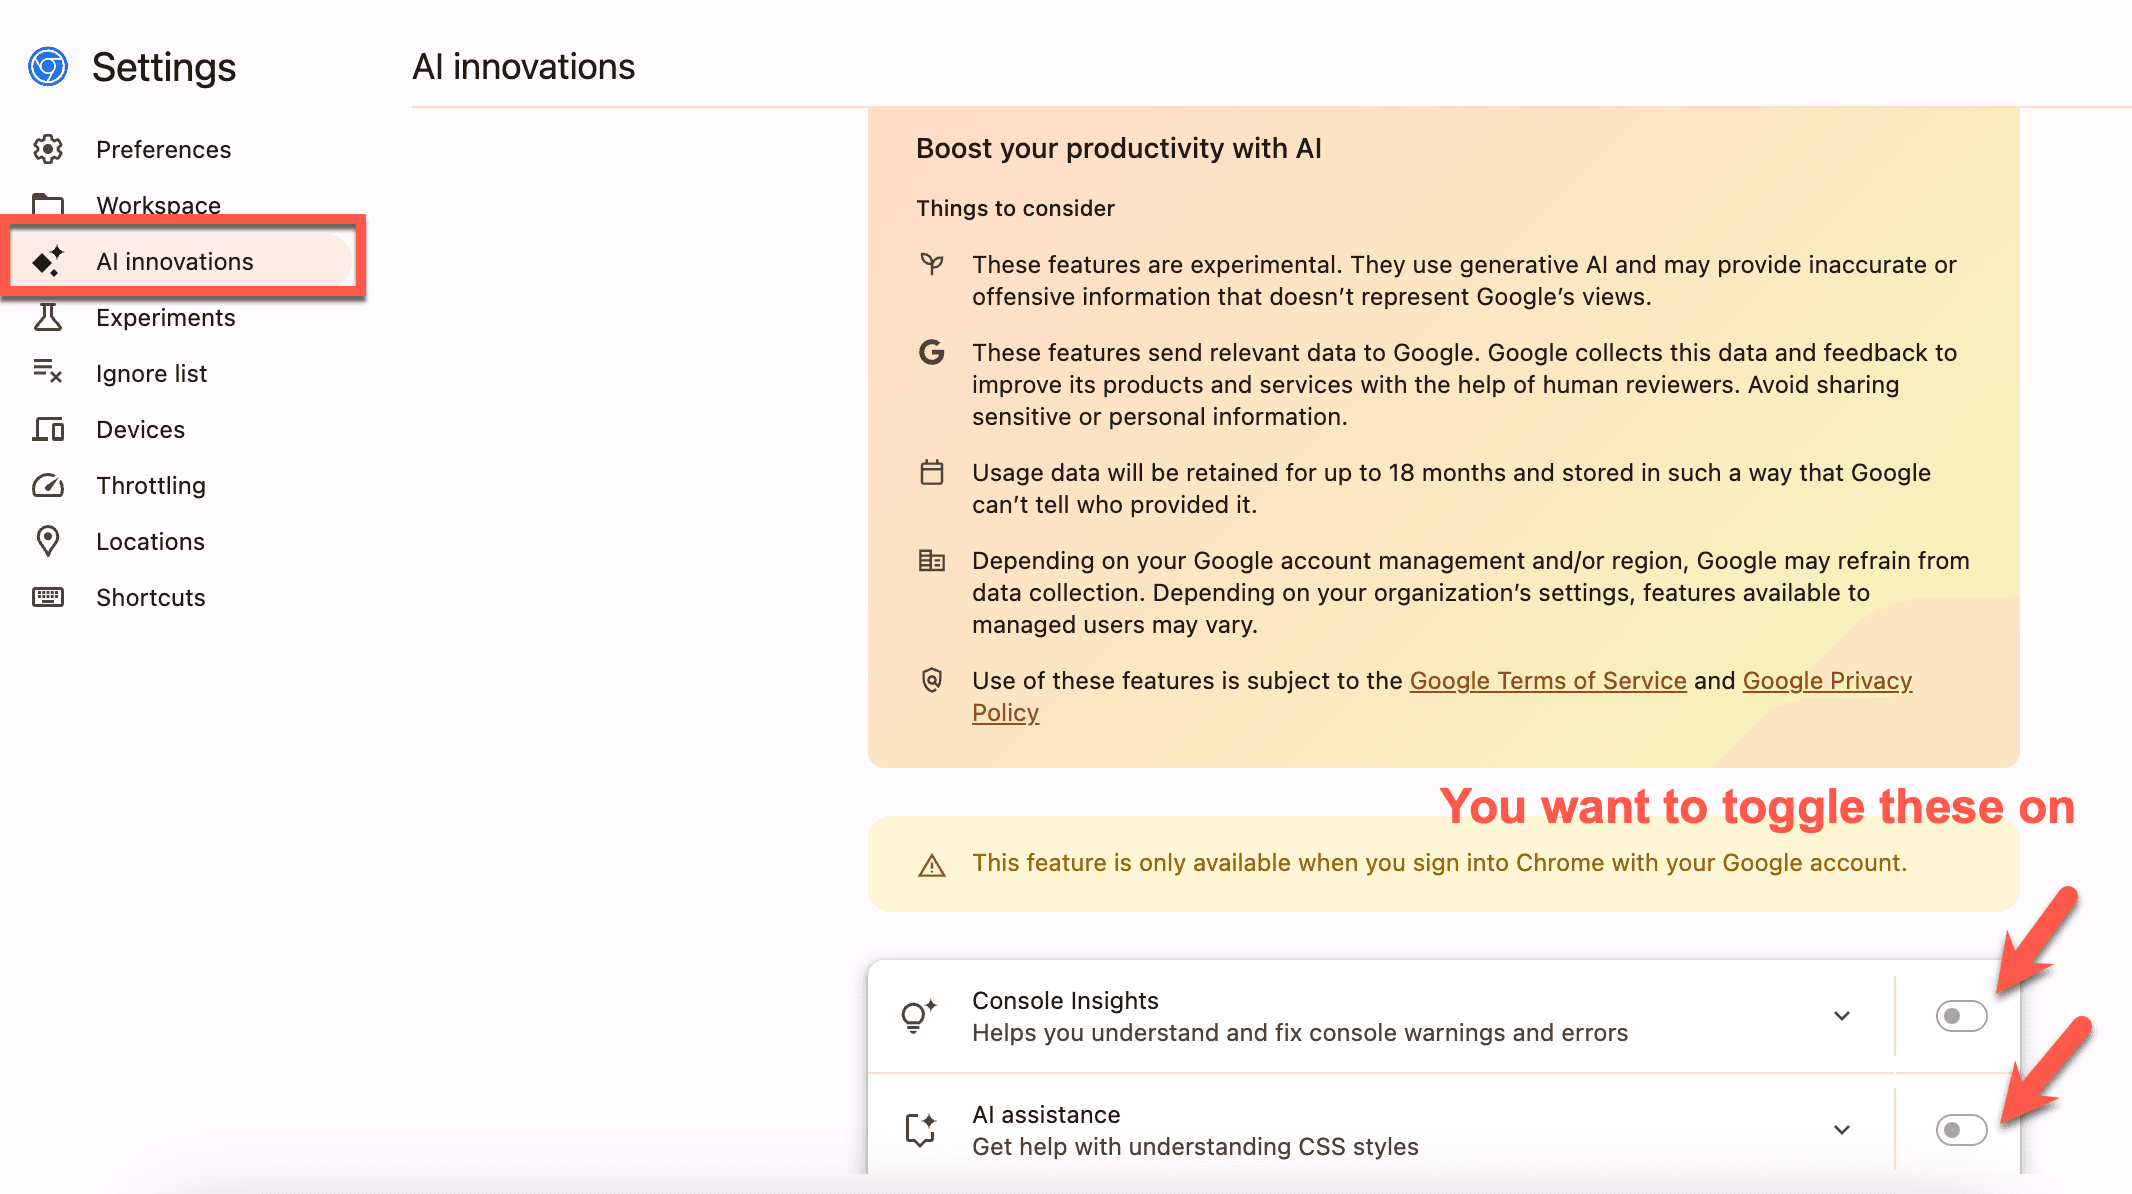
To enable AI assistance, navigate to the Chrome DevTools settings, where you’ll find a new AI Innovations tab.
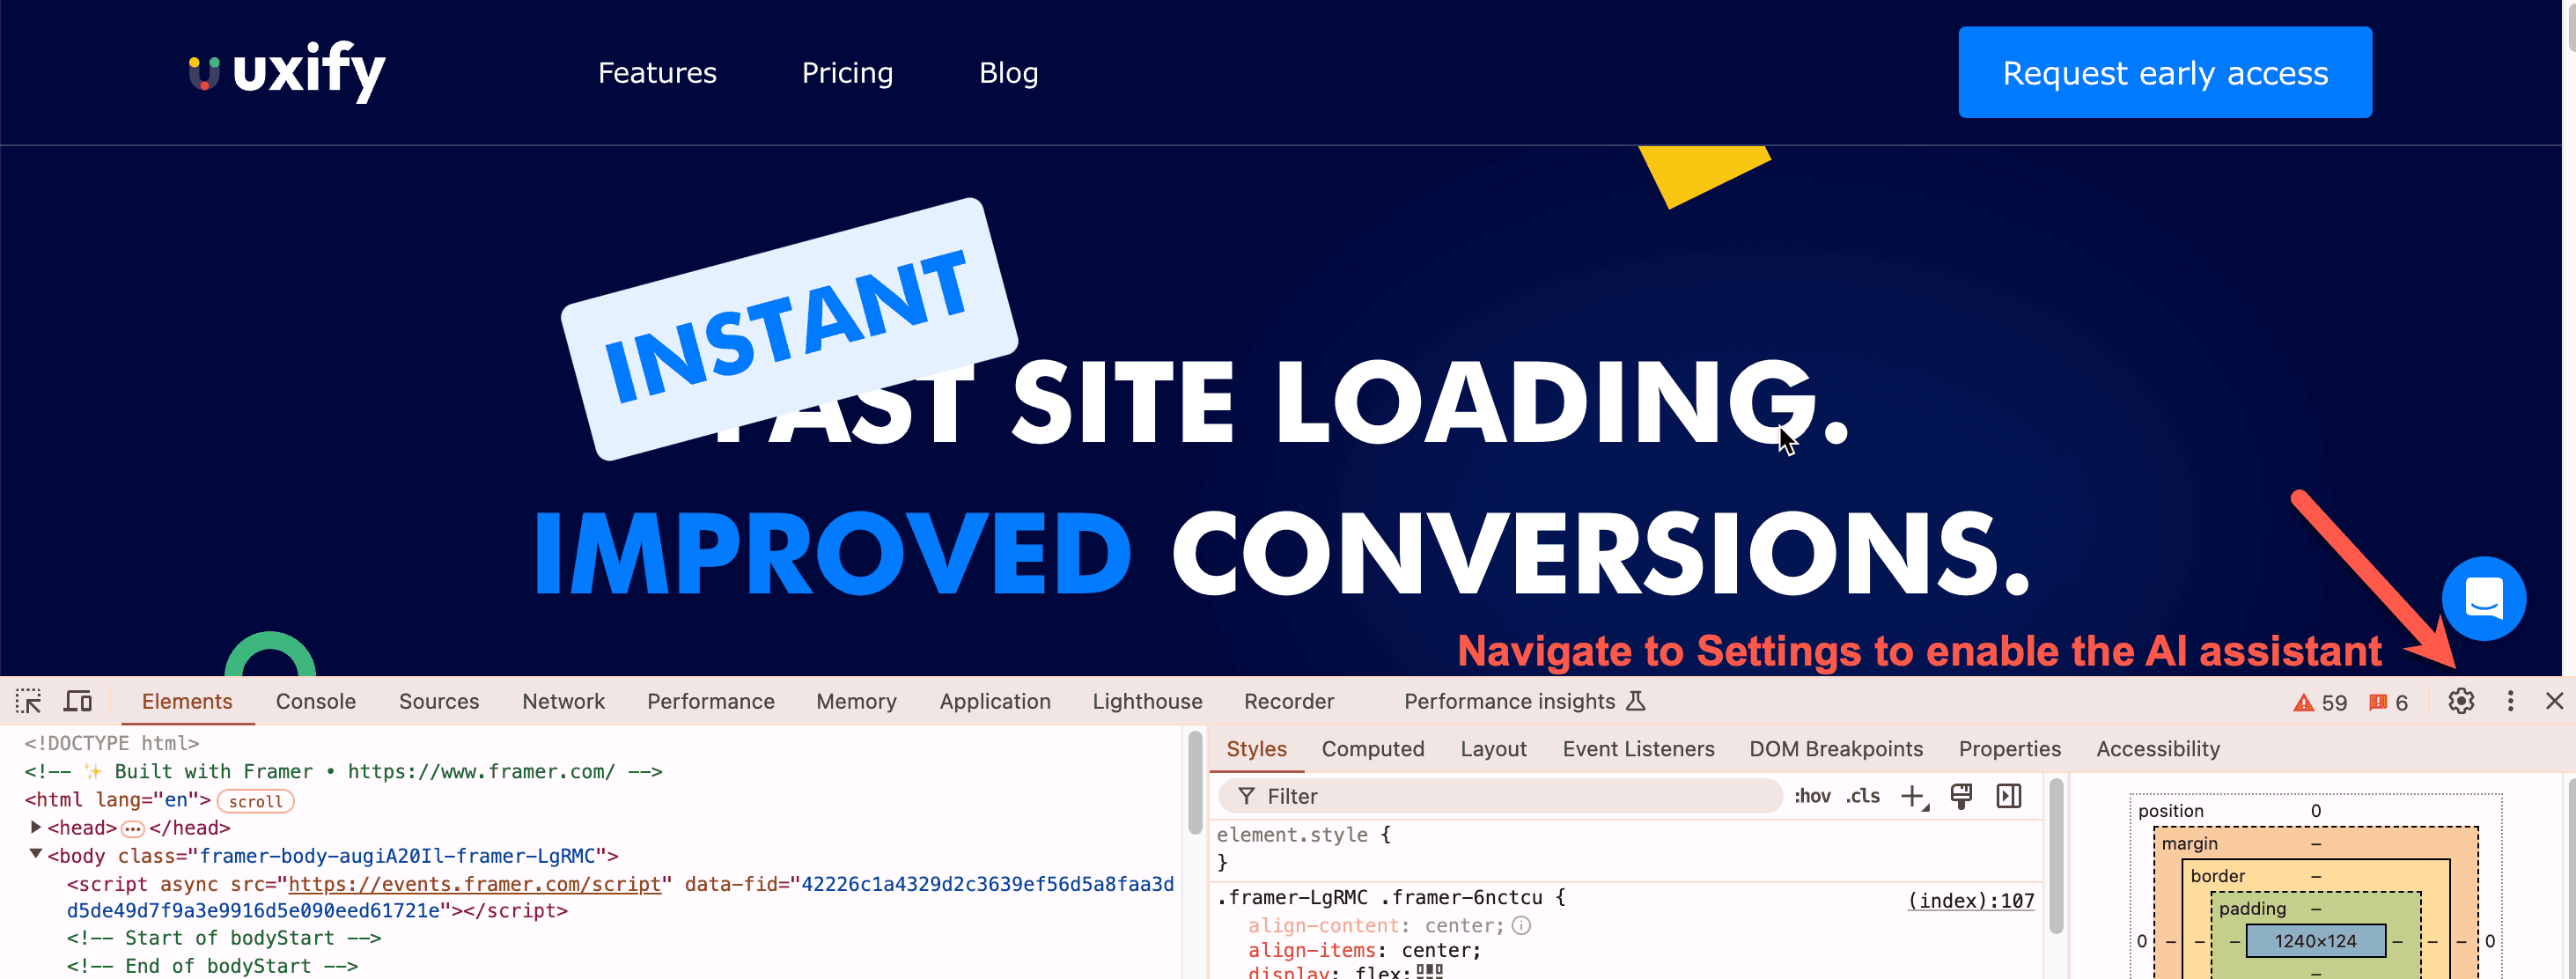
Once you’re signed into your Chrome account, toggle on the following features:
Console Insights: Offers guidance on console warnings and errors, along with code suggestions to resolve issues.
AI Assistance: Provides CSS style recommendations and contextual explanations to streamline your development workflow.
Since this feature is experimental, data may be reviewed by humans to improve AI accuracy, so avoid using it on pages with sensitive information.
Debug and improve CSS with AI assistance
To activate AI assistance in the Elements panel, right-click on a node in the DOM tree and select "Ask AI," or use the AI icon that appears in the window then the element is selected. This automatically opens the AI assistant, where you can ask questions about the selected element.
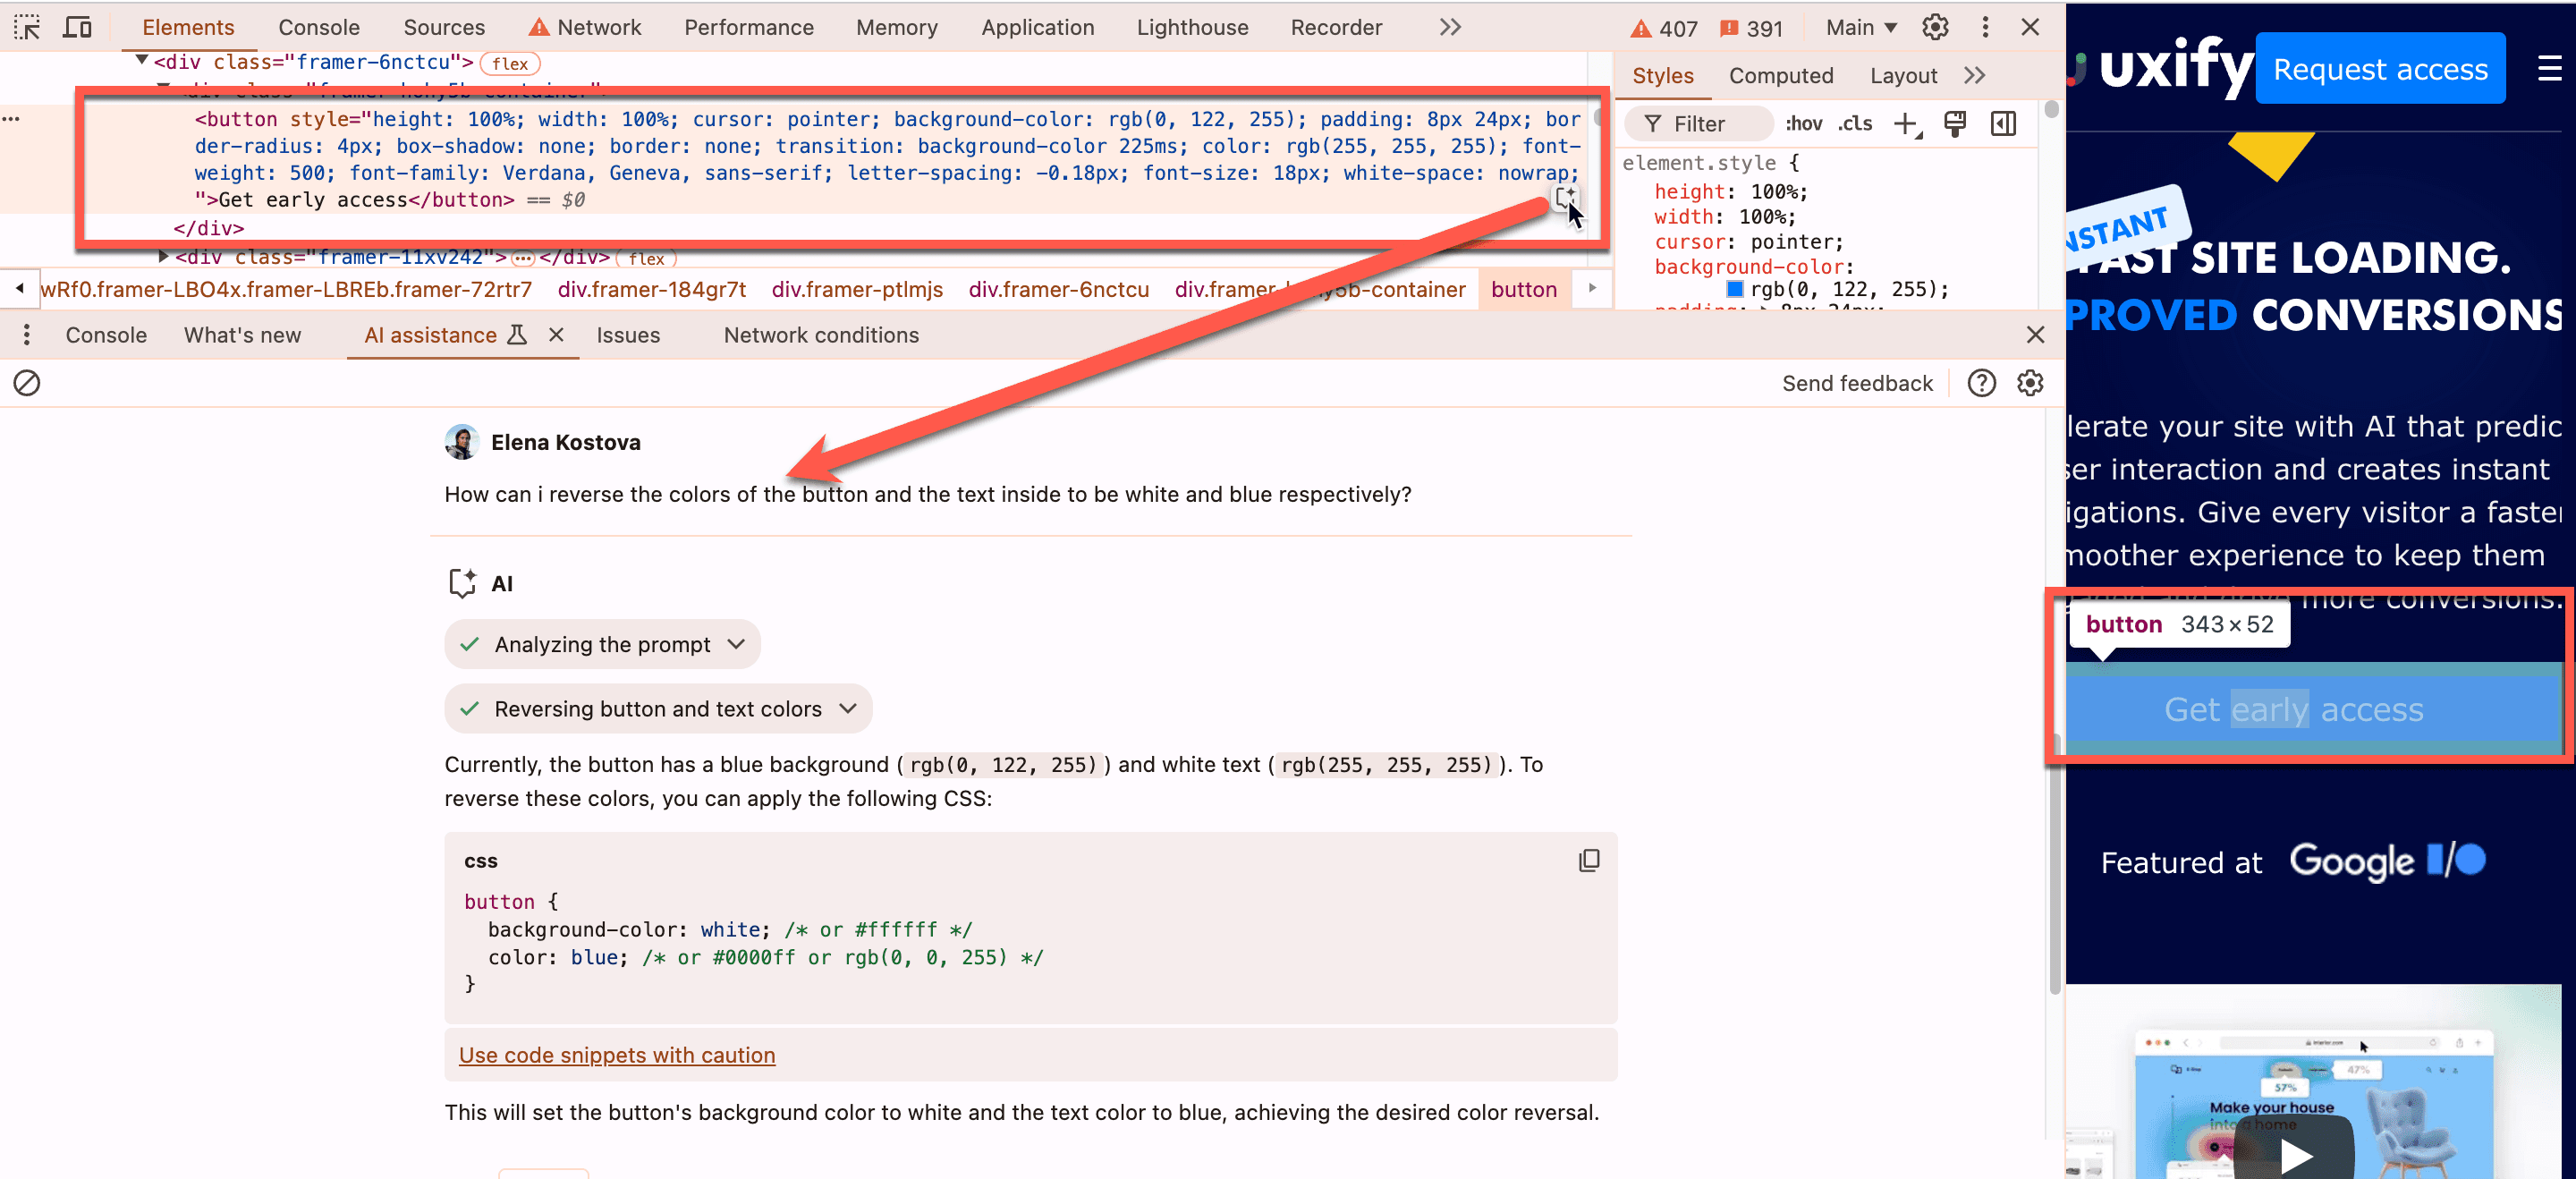
Here are some examples of how you can use the AI assistance to improve your styling:
Understand Layouts Better: Gain insights into layout structure and ensure you’re using the best CSS properties for the existing code.
Improve Accessibility: Check and refine site accessibility, aligning with Web Content Accessibility Guidelines.
Enhance Design: Use AI to adjust styling, such as colors, form elements, and sizes, for a better look and feel.
Requirements
To use the AI Assistance panel, ensure you meet the following requirements:
The feature must be available in your location.
You must be at least 18 years old.
You need to be using Chrome Canary version 131 or later.
You must be signed into a Google account within Chrome.
The DevTools language setting must be set to English.
AI Assistance must be enabled in DevTools settings.
Known issues and security
As with all large language models, AI responses may sometimes include inaccurate elements or incorrect solutions. It’s essential to double-check any suggestions against your source code before implementing them.
Additionally, some data may be reviewed for quality assurance purposes, so avoid using prompts that contain sensitive or personal information. For further details, you can review how your personal information will be used in the AI assistance.
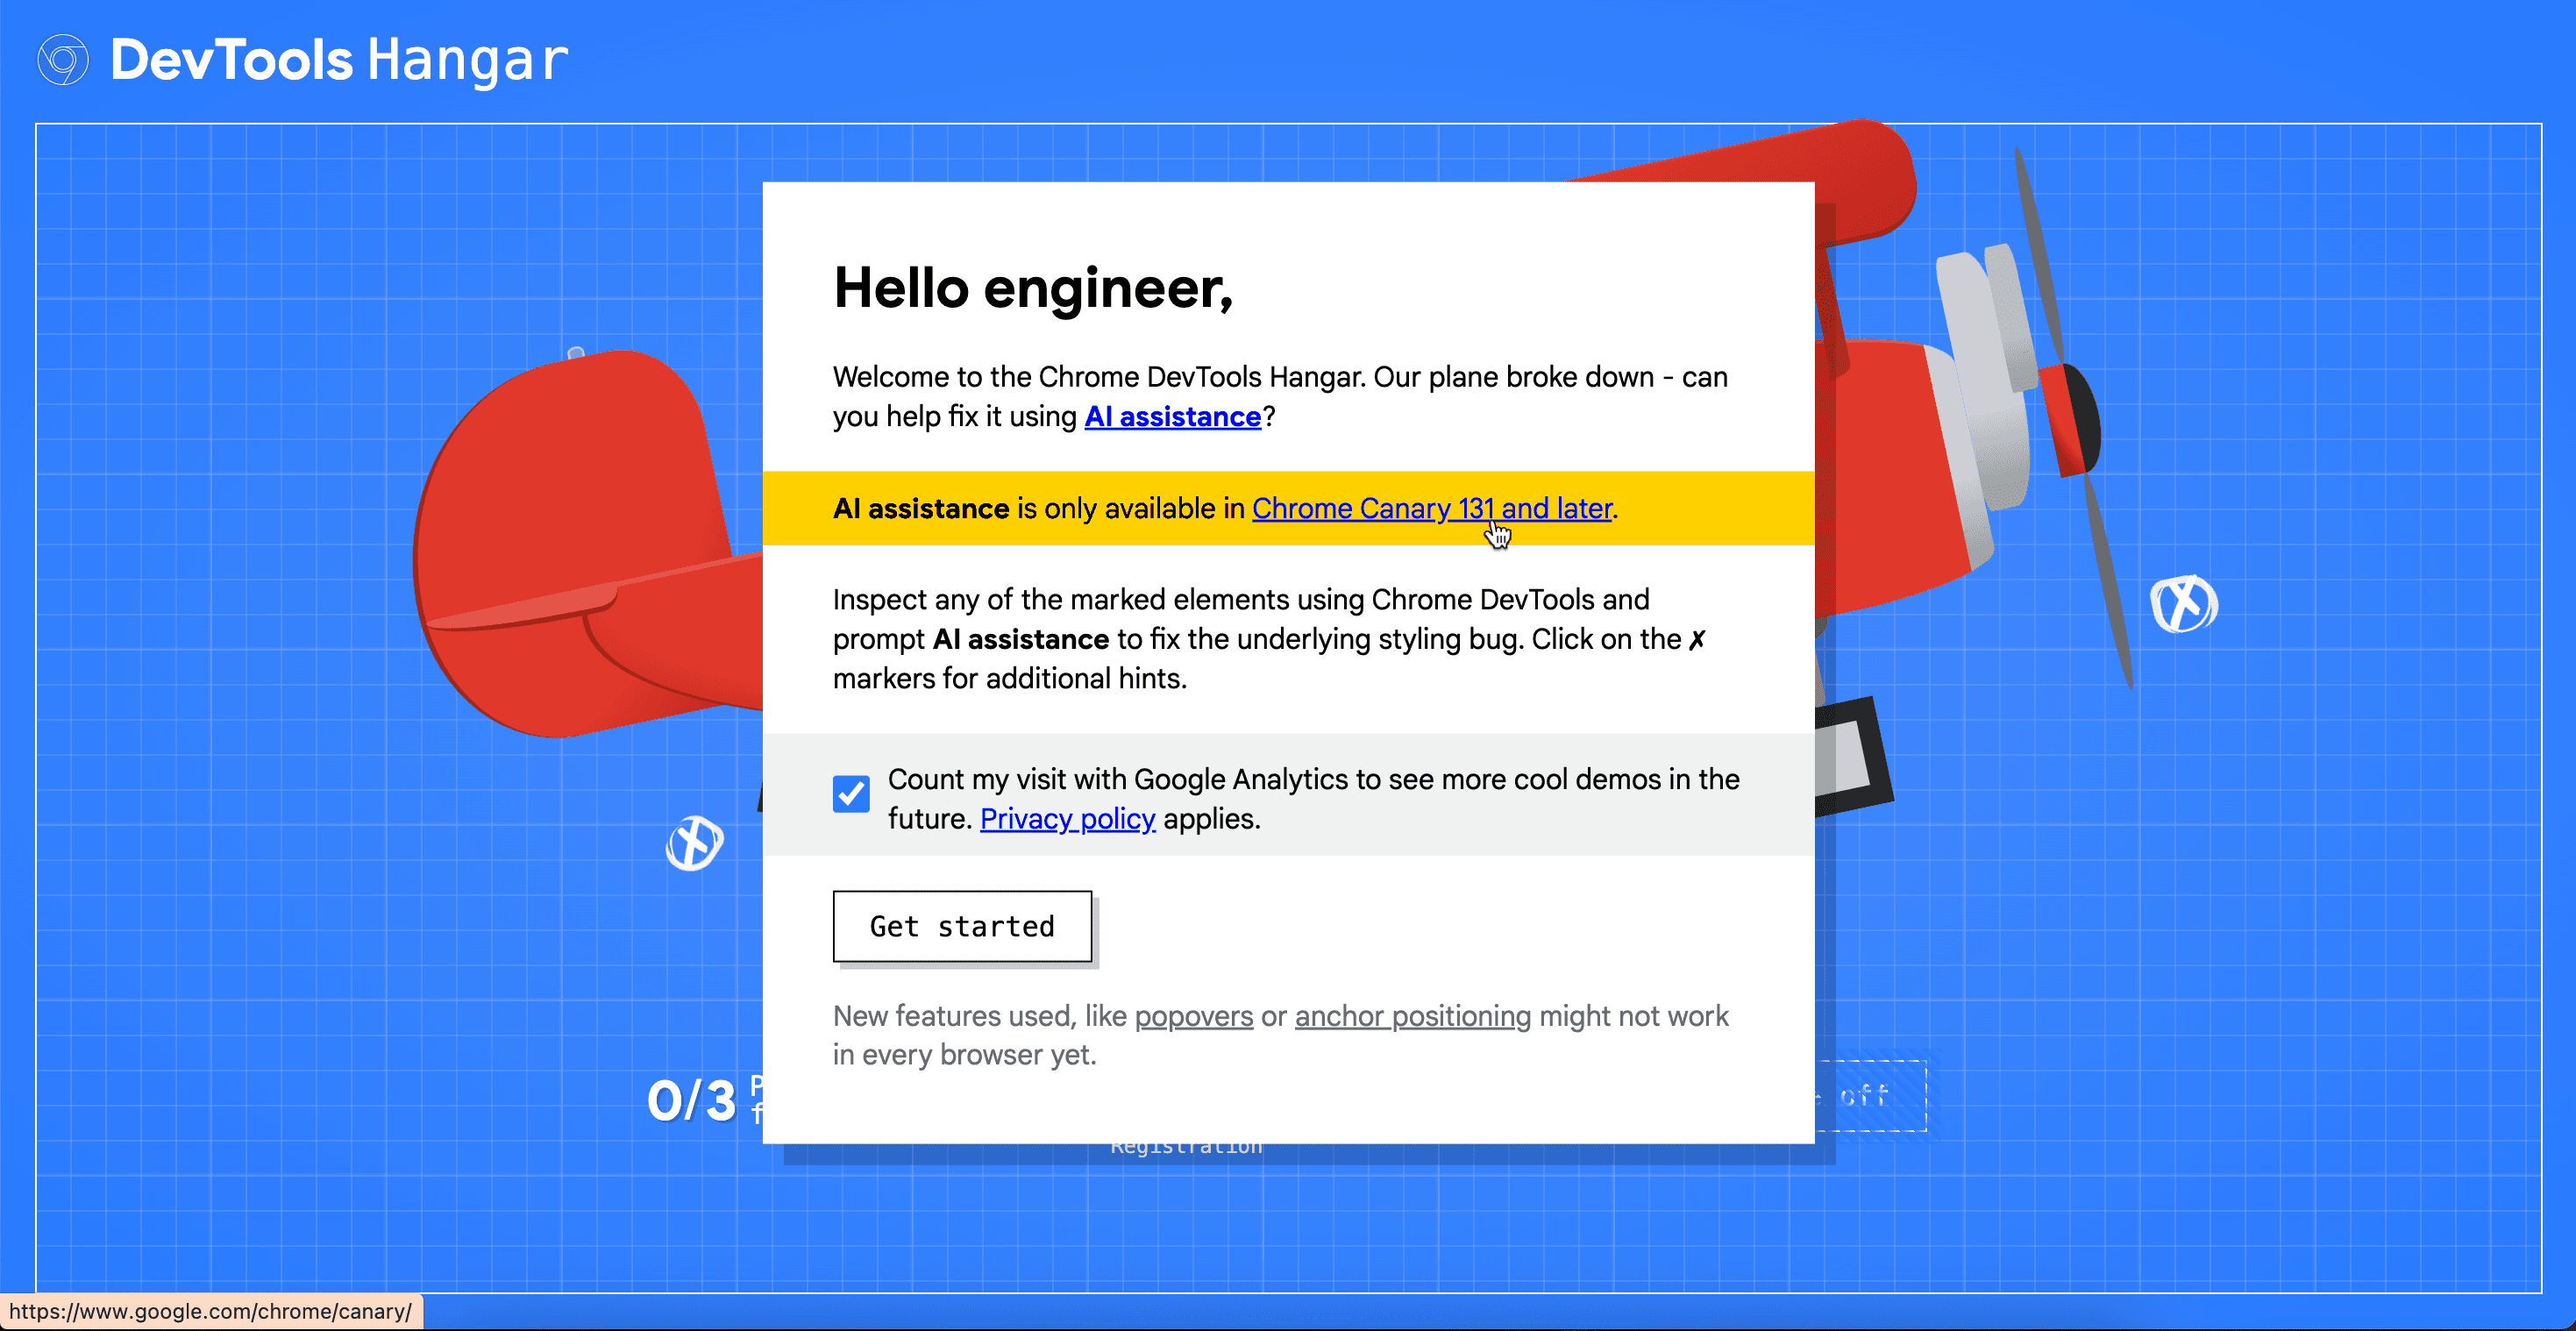
Chrome Dev Tools Hangar
Want to dive deeper into AI assistance? The Chrome DevTools Hangar offers an interactive playground where you can experiment with these new tools in a hands-on way. Perfect for getting comfortable with AI-driven features and exploring their potential—take it for a spin before you log off for the day!
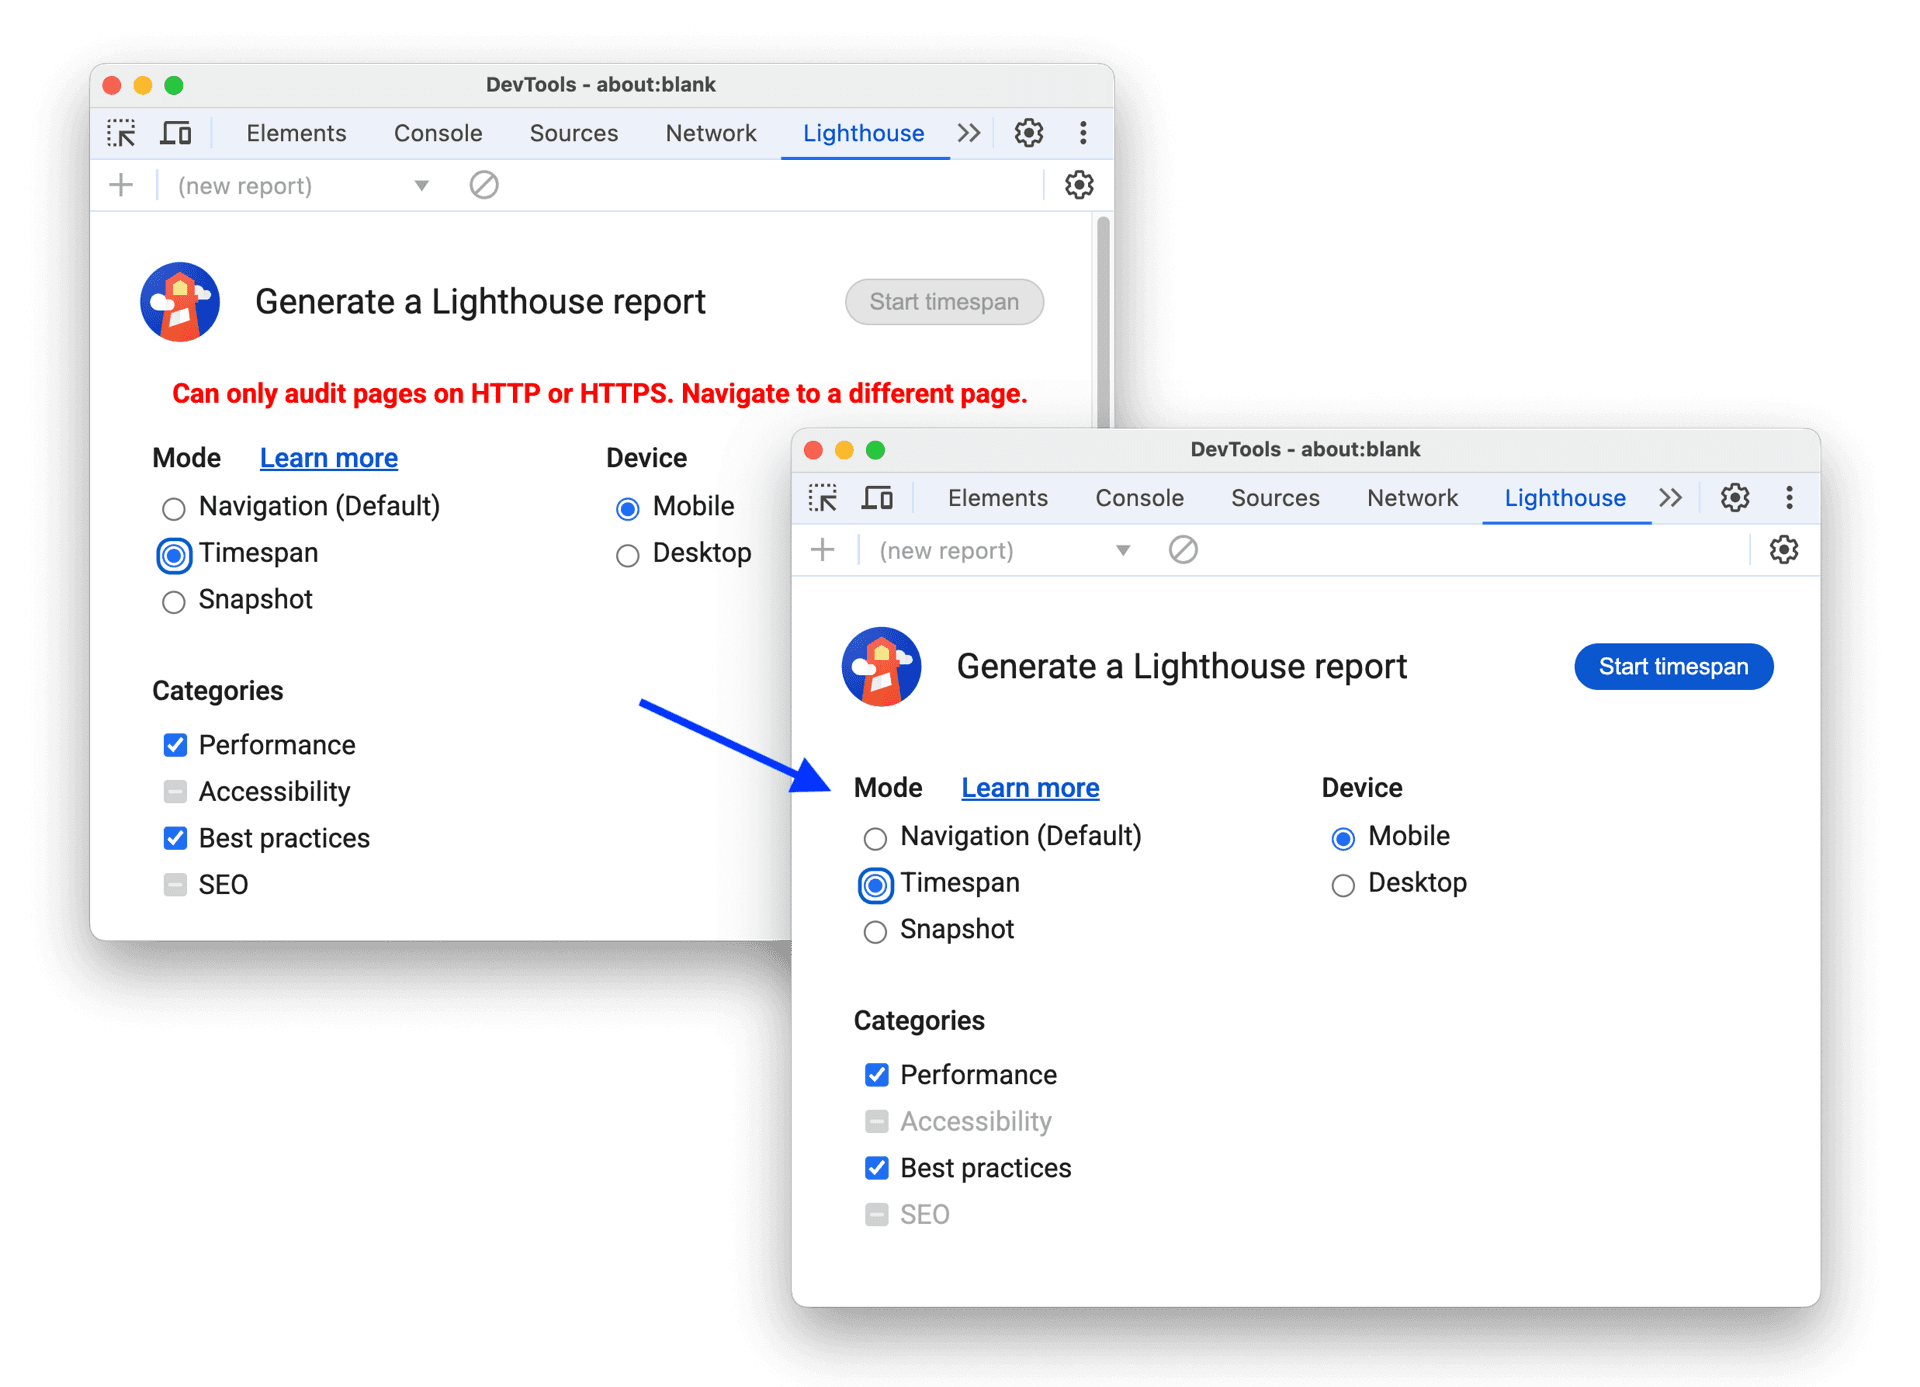
Lighthouse updates
Lighthouse can now generate reports for non-HTTP pages in timespan and snapshot modes.
Chrome for Developers, What's new in DevTools, Chrome 131
For a complete overview of all DevTools updates in Chrome 131 visit Chrome’s Developer Blog.
Quick Tip: Consider using Chrome Canary, Dev, or Beta as your primary development browser to access the latest DevTools features, test cutting-edge APIs, and catch potential issues before your users do!

