
Five years after Google introduced Core Web Vitals (CWVs), performance is no longer a “nice to have” — it’s a business necessity. What started as a technical ranking signal in 2021 has evolved into a key performance indicator for user experience, conversions, and brand perception.
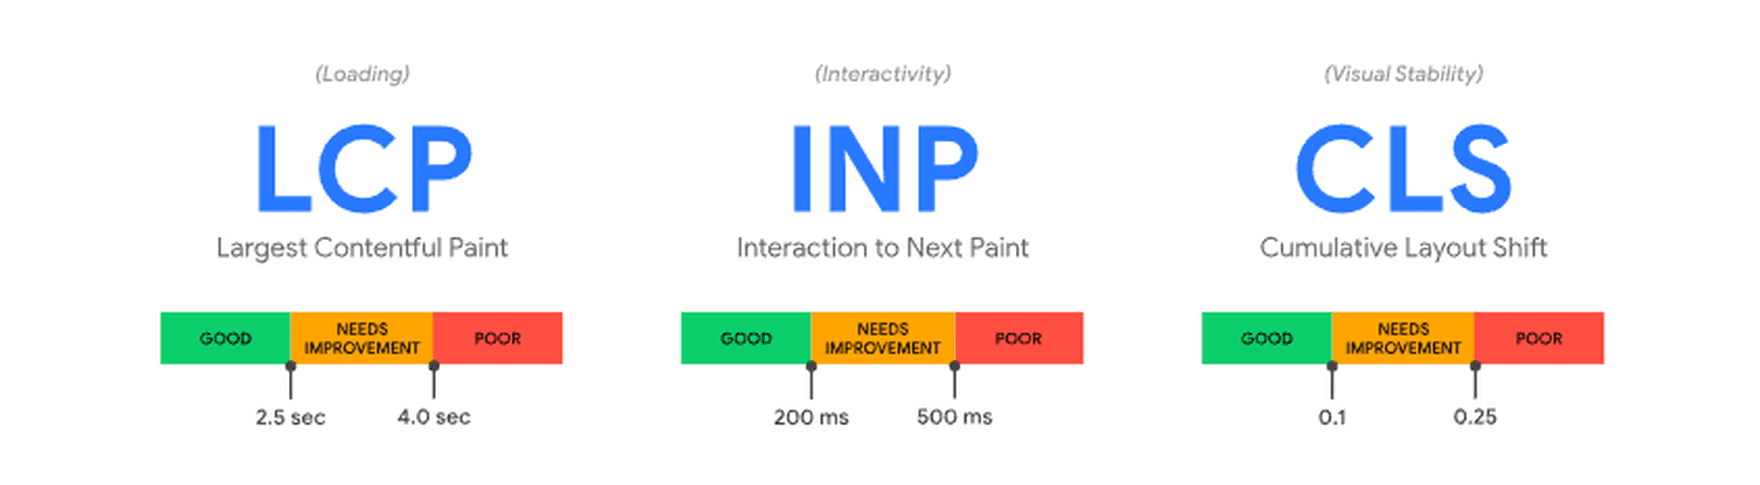
In 2024, Google replaced FID (First Input Delay) with INP (Interaction to Next Paint), raising the bar for what qualifies as a fast and responsive site. This shift confirmed what we’ve known for years: users expect instant, smooth experiences, and Google is rewarding those who deliver them.
The bigger picture: Performance trends since 2020
To understand where we are today, let’s rewind to where it all started.
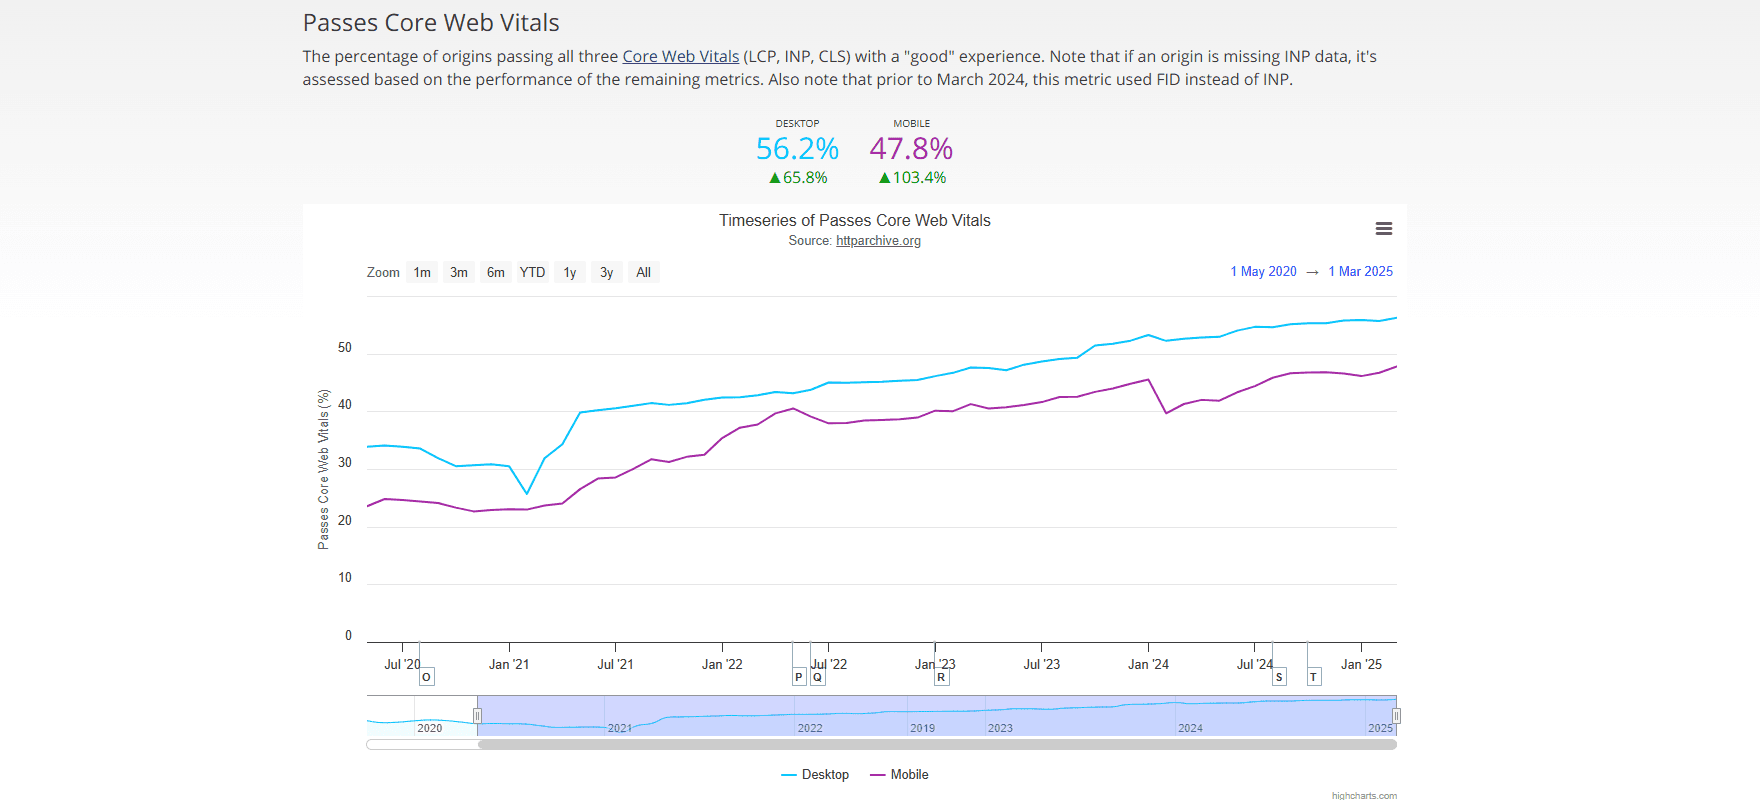
Back in May 2020, only a small percentage of websites passed all three Core Web Vitals. Fast-forward to March 2025, and the web looks and feels very different. More business owners are prioritizing performance. More platforms (WordPress, Shopify, Wix and others) are baking speed into their products. And more users are noticing the difference.
source: HTTP Archive
Since Core Web Vitals launched in 2020, both desktop and mobile performance have seen strong, steady improvements across the web — a reflection of the growing attention businesses are placing on speed and user experience.
From platforms optimizing their defaults to brands investing in performance audits, it’s clear that web performance has shifted from a backend concern to a strategic priority.
See how T-Mobile’s organization-wide priority shift to Core Web Vitals paid off big.
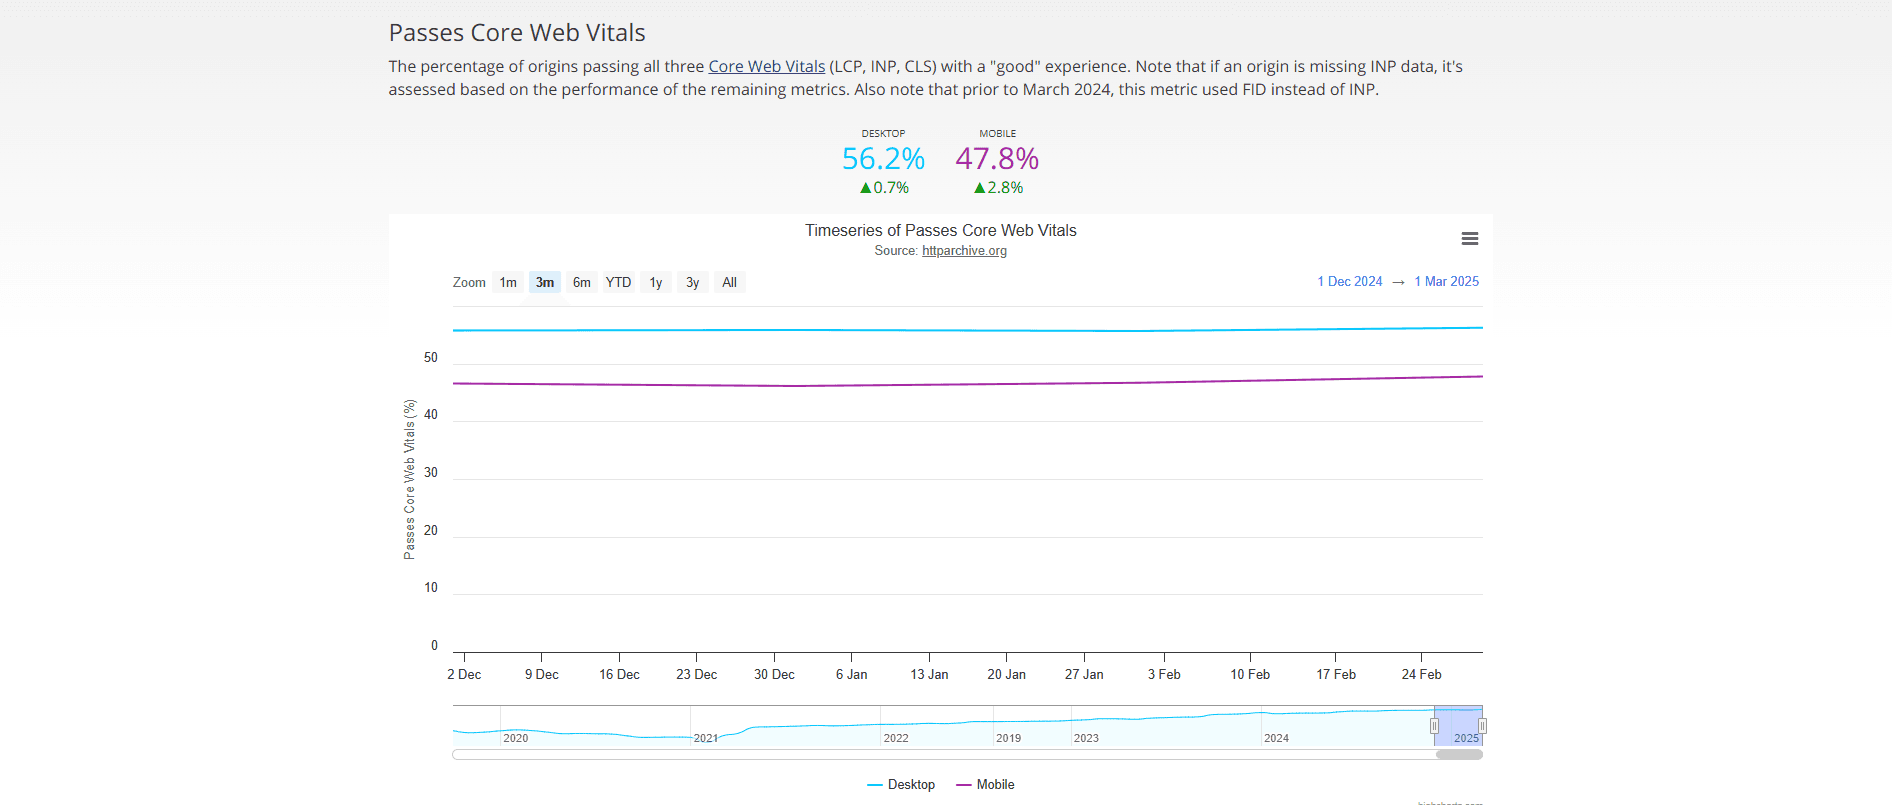
Zooming in: How performance improved in Q1 2025
So, how did Q1 2025 stack up?
To measure real progress, we compared performance data from December 2024 to March 2025 across three key metrics:
Global CWV Pass Rate (Q4 2024 vs Q1 2025)
The percentage of websites passing all Core Web Vitals ticked up again in Q1, signaling not just broader awareness but real action from web teams across industries.
Metric | Improvement (Desktop) | Improvement (Mobile) |
|---|---|---|
CWV Pass Rate | +0.7% | +2.8% |
LCP | +0.1% | +1.6% |
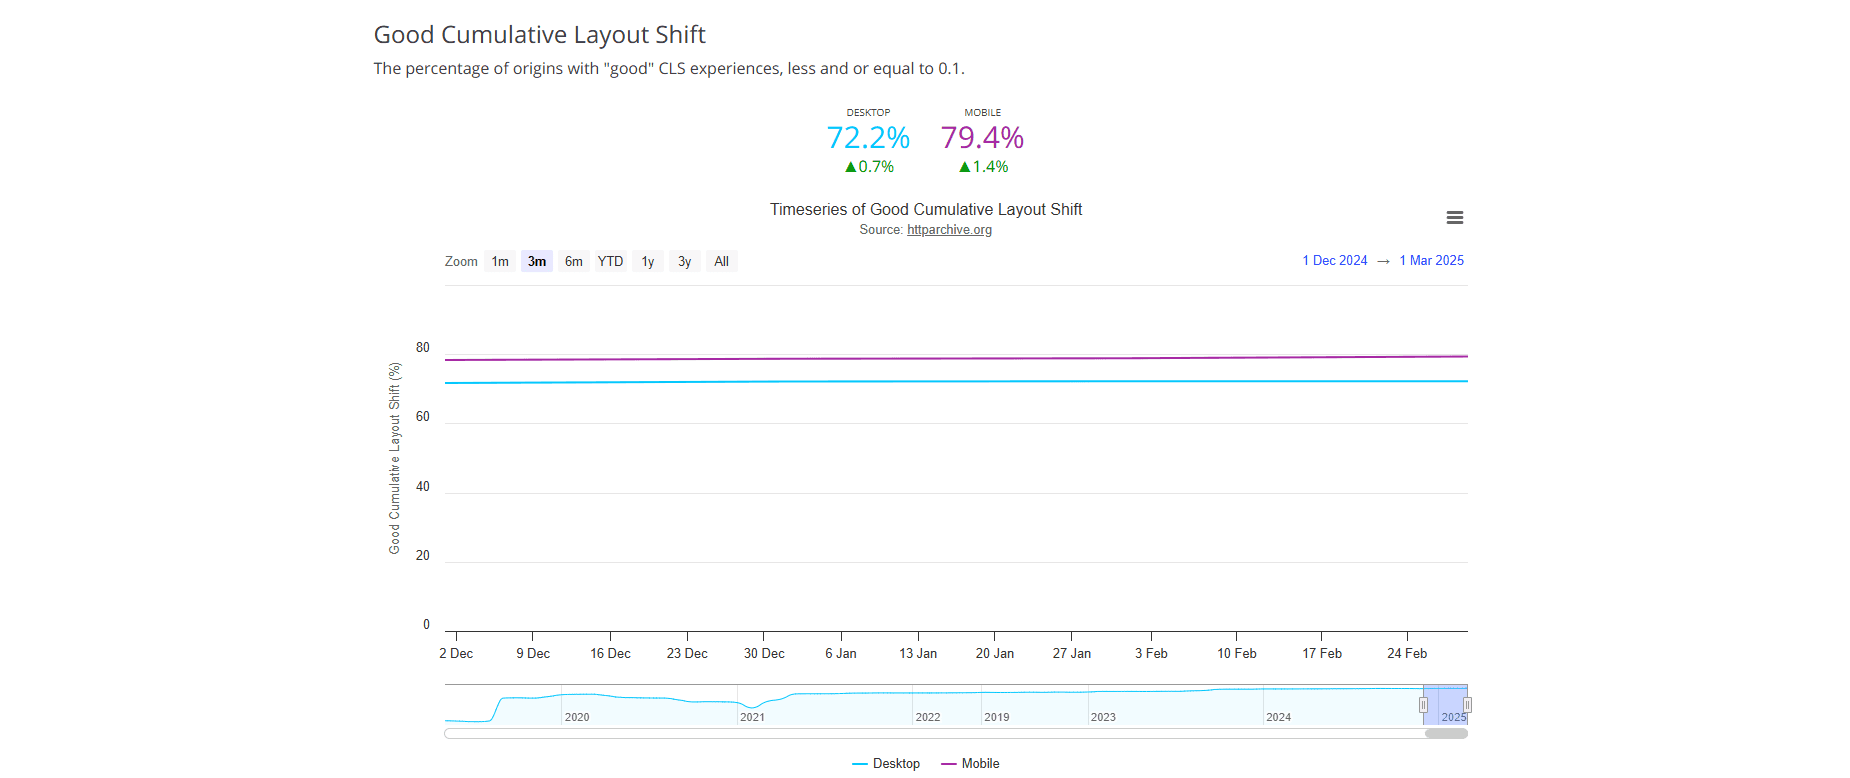
CLS | +0.7% | +1.4% |
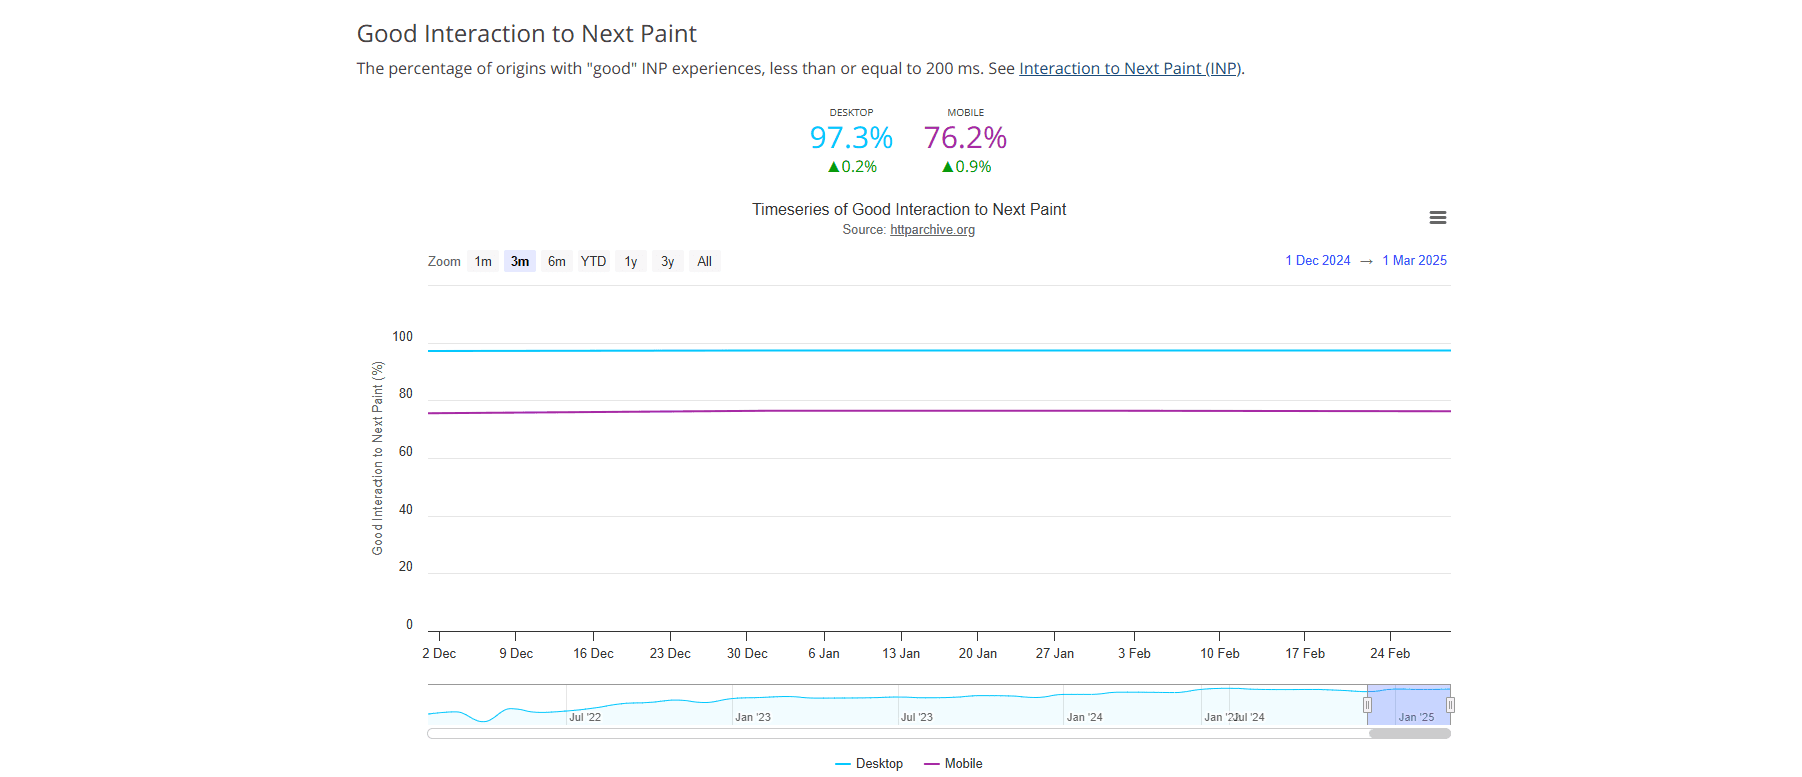
INP | +0.2% | +0.9% |
Desktop CWVs saw a 0.7% lift, while mobile CWVs gained 2.8%, continuing the upward trend we’ve seen over the past few years. These improvements may seem incremental, but at scale, they reflect thousands of sites taking tangible steps toward faster, more user-friendly experiences.
source: HTTP Archive
Key takeaway: every quarter, more websites are meeting the CWV benchmark — not by accident, but through intentional optimizations that are paying off in speed, engagement, and user trust.
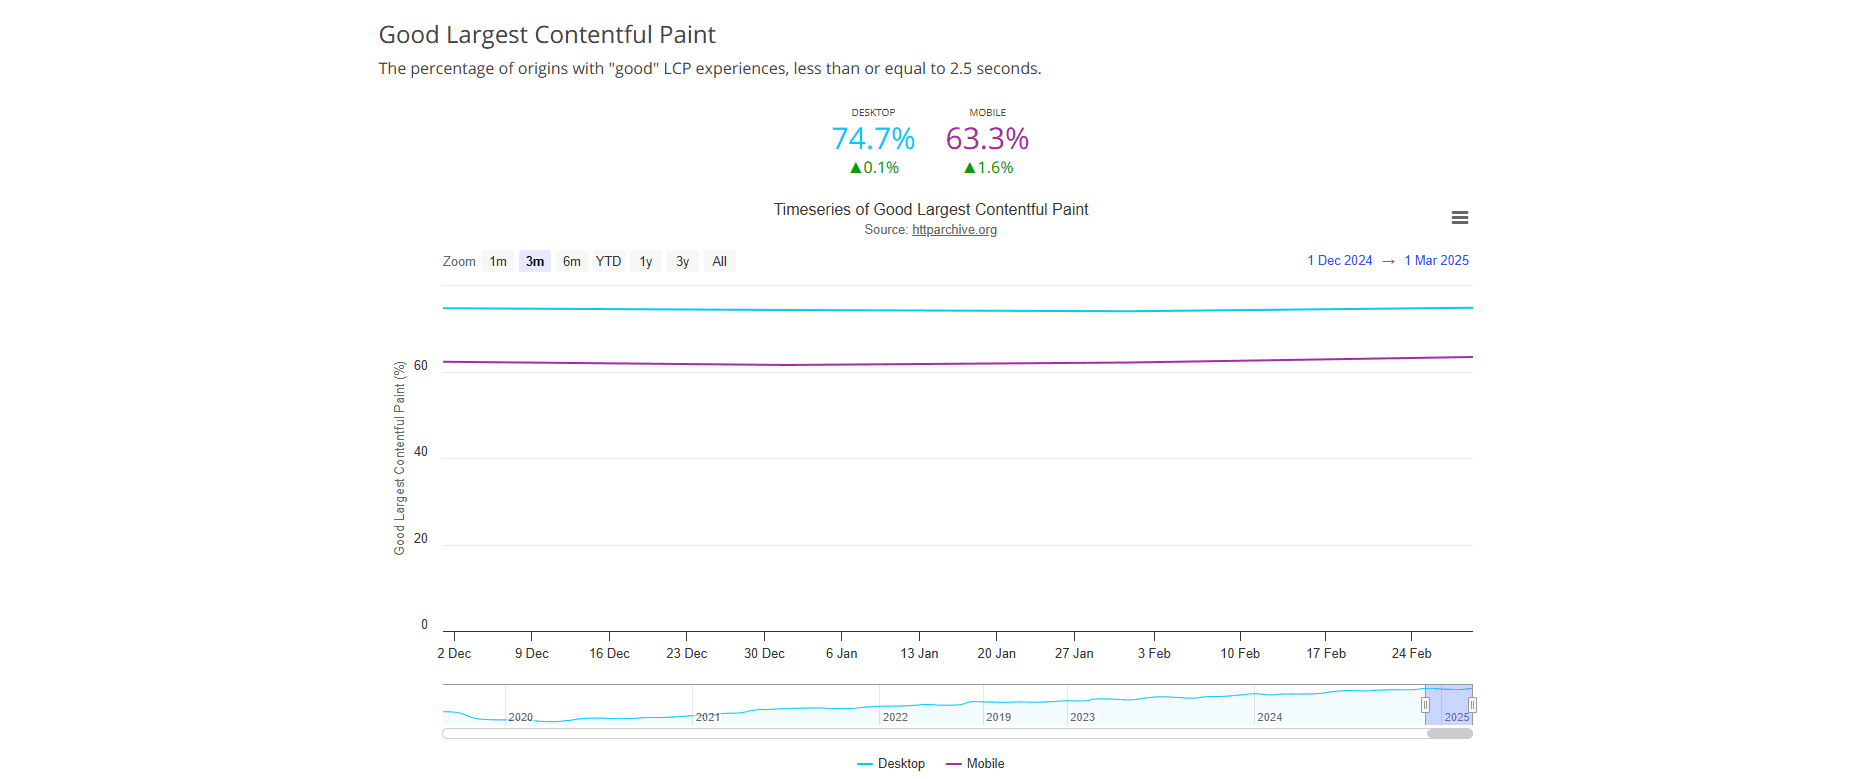
Largest Contentful Paint (LCP) trends
LCP improvements in Q1 were modest on desktop at +0.1%, but far more pronounced on mobile, where sites saw a 1.6% uplift. That’s an encouraging shift, especially considering how mobile experiences often bear the brunt of heavier pages and slower networks.
What’s driving this? Smarter defaults and better tooling. Web teams are embracing:
Next-gen image formats like AVIF and WebP
Lighter JavaScript bundles via smarter builds and code splitting
Preloading strategies, including speculative loading and AI-based navigation predictions
source: HTTP Archive
The gains may be incremental, but in mobile-first environments, even small LCP improvements can translate to better engagement and reduced bounce rates.

For actionable strategies to boost LCP, check out our guide on improving LCP.
Cumulative Layout Shift (CLS) trends
CLS continued its steady path of improvement in Q1, with desktop sites improving by 0.7% and mobile by 1.4%.
This progress stems from more sites:
Reserving space for dynamic content
Optimizing third-party scripts and ad placements
Using layout-stable design components and modern fonts
source: HTTP Archive
Visual stability remains one of the easiest CWV wins when handled early, and these results show that more teams are getting it right.
Want to dig deeper? Here’s a handy post on minimizing CLS with practical tips.
Interaction to Next Paint (INP) trends
Q1 saw meaningful gains in INP, especially on mobile. Desktop improved by 0.2%, while mobile saw a 0.9% lift — a sign that developers are beginning to treat responsiveness with the same seriousness as load time.
Common improvements included:
Splitting up long JavaScript tasks
Deferring non-critical work until idle
Improving input handling during peak interactivity
source: HTTP Archive
As INP solidifies its place in the performance toolkit, these early results show that responsiveness is moving from theory to practice, especially where it matters most: on mobile.
You can use our INP optimization tips for ideas on how to streamline responsiveness in real-world performance.
What’s driving these wins?
Behind every percentage point of progress, there’s a shift in how performance is being prioritized — not just by developers, but by entire product teams, marketers, and decision-makers.
We’re seeing smarter, more deliberate strategies come into play:
AI-based speculative loading is helping websites predict and preload where users will go next, making navigation feel instant.
Better caching practices and CDNs are reducing the time it takes to load repeat content.
Lighter UX design choices are streamlining the page experience, especially on mobile, where performance matters most.
Platforms are stepping up, too. Modern CMSs and ecommerce platforms are integrating performance best practices by default. Frameworks are prioritizing responsiveness. And browser tooling is more transparent than ever.
Performance improvements are no longer just technical wins — they’re business wins.
Looking ahead: What to expect in Q2 and beyond
Q1 proved that performance momentum is real. Now the focus shifts to what’s next.
Here’s what we expect to see more of in Q2:
🔎 INP-focused audits are becoming standard across performance reviews and audits.
With INP now fully in the spotlight, more teams are measuring and improving interaction latency as part of their core metrics.🚀 Speculative loading and navigation preloading are gaining mainstream traction.
Tools like Navigation AI are showing how predicting user journeys can lead to instant-feeling websites, boosting engagement and retention.💰 Performance linked directly to ROI
Businesses are no longer optimizing “for Google”, they’re optimizing for users. Expect more teams to tie faster experiences to conversion rate, cart completion, and retained revenue.

Final Takeaway
Q1 2025 wasn’t just another quarter. It marked a shift in how performance is approached - not as a one-off fix, but as an ongoing competitive strategy.
As Core Web Vitals evolve and user expectations keep rising, one thing is clear:
Speed is no longer a technical fix - it’s a business advantage.

" height="200.00000219726564px" id="j9Mmwfnw8" transform="translate(143.5 0)" width="479.5329973144531px"/><path d="M 0 15.944 C 0 7.139 7.154 0 15.98 0 C 24.804 0 31.959 7.138 31.959 15.943 L 31.959 59.637 C 31.959 68.442 39.113 75.58 47.938 75.58 C 56.763 75.58 63.917 68.442 63.917 59.637 L 63.917 15.944 C 63.917 7.139 71.071 0.001 79.897 0.001 C 88.721 0.001 95.875 7.139 95.875 15.944 L 95.875 56.095 C 95.875 82.51 74.413 103.923 47.938 103.923 C 21.462 103.923 0 82.51 0 56.095 Z" fill="rgb(59, 63, 91)" height="103.923px" id="KJCDMITFE" transform="translate(0 53)" width="95.875px"/><path d="M 0 15.943 C 0 7.138 7.154 0 15.979 0 C 24.804 0 31.958 7.138 31.958 15.943 C 31.958 24.748 24.804 31.886 15.979 31.886 C 7.154 31.886 0 24.748 0 15.943 Z" fill="rgb(252, 200, 0)" height="31.885999999999996px" id="q2K9EYOvZ" transform="translate(0 53)" width="31.95799999999963px"/><path d="M 0 15.943 C 0 7.138 7.154 0 15.979 0 C 24.804 0 31.958 7.138 31.958 15.943 C 31.958 24.748 24.804 31.886 15.979 31.886 C 7.154 31.886 0 24.748 0 15.943 Z" fill="rgb(63, 184, 126)" height="31.885999999999996px" id="bBya7XCj7" transform="translate(64 53)" width="31.95799999999963px"/><path d="M 0 14.171 C 0 6.344 6.359 0 14.204 0 C 22.048 0 28.407 6.344 28.407 14.171 C 28.407 21.997 22.048 28.342 14.204 28.342 C 6.359 28.342 0 21.997 0 14.171 Z" fill="rgb(229, 0, 106)" height="28.341999999999985px" id="WNzwBFOi7" transform="translate(34.5 128.5)" width="28.407000000000153px"/></g></svg>)