
Site speed is not just a developer concern - it directly affects rankings, conversions, and user retention. Google Lighthouse gives you a structured, repeatable way to diagnose performance problems before they reach real users. But knowing when to use it, and when to move beyond it, is what separates teams that maintain fast sites from teams that just audit them.
What is Google Lighthouse?
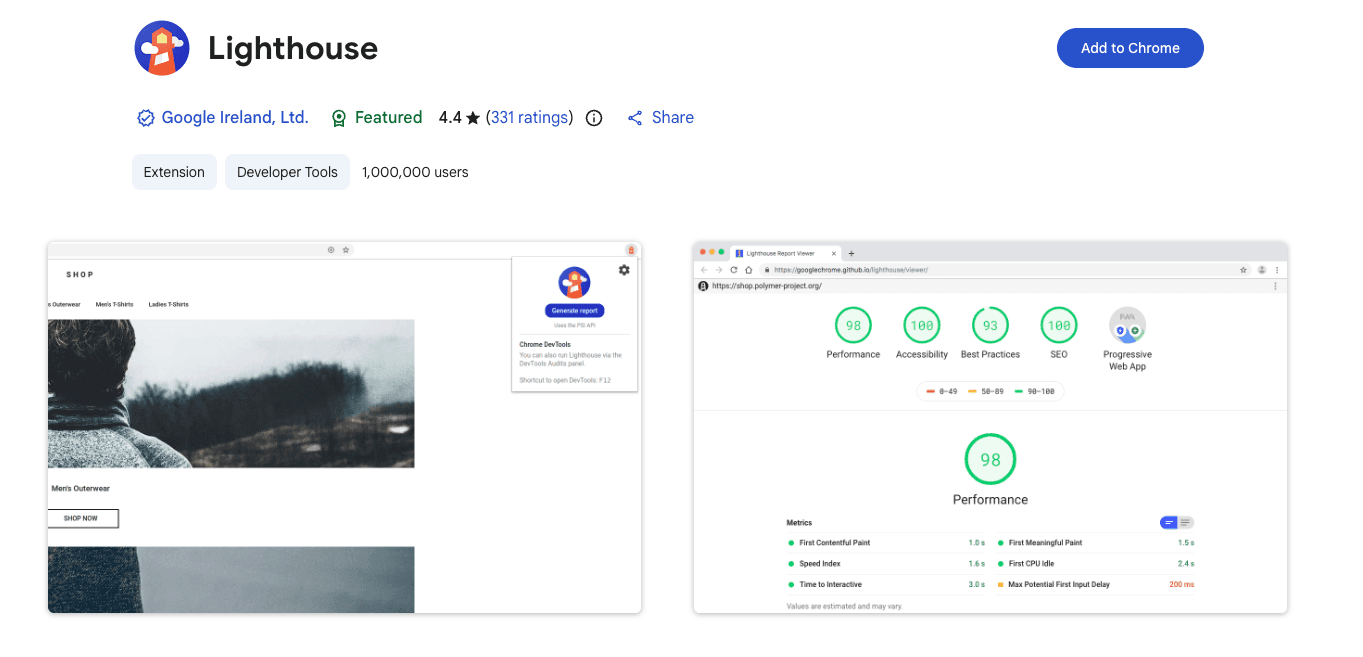
Google Lighthouse is an open-source automated tool available in Chrome DevTools, from the command line, and as a Node module. It measures the quality of web pages during development. You can run it against any web page, whether public or requiring authentication.
The tool focuses on performance, accessibility, and search engine optimization metrics. Google Lighthouse audits your web page and generates a report with actionable insights. You can use it to debug performance issues before they hit production.
Google created the tool to help make the web faster and more user-friendly. They wanted a standardized way to measure a site’s performance without relying on opinions. The Lighthouse report breaks down your site’s health into four categories:
Performance: Measures how quickly your content loads by evaluating page features such as First Contentful Paint, Largest Contentful Paint, Time to First Byte, etc.
Accessibility: Checks whether your site is accessible to everyone by evaluating, for example, text and background color contrast ratio.
Best practices: Verifies that you’re using HTTPS and checks if your images display at the correct resolution and aspect ratios. It also checks for outdated APIs that modern browsers struggle to handle efficiently. Measures sites’ security and health according to modern standards.
SEO: Ensures your site is discoverable by search engines and that elements have the necessary HTML tags, robots.txt is valid, etc.
Once the site goes live and starts attracting traffic, Lighthouse transitions from your primary signal to a supporting diagnostic tool. At this stage, you should focus on Core Web Vitals data, sourced through PageSpeed Insights or Google Search Console for more accurate and actionable real-user performance data.
Why Use Google Lighthouse?
You cannot optimize what you don’t measure. Google Lighthouse gives you a score to aim for, simplifying the optimization process. It turns a complex technical problem into a simple checklist you can actually finish.
These are suggestions, however. You may need input from professional web developers to get the statistics where you want them.
For SEOs, Google Lighthouse is a sandbox for testing improvements before they go live. However, because Google uses real-user data (Core Web Vitals) for rankings, Lighthouse should be used to catch technical errors before your site is accessible to users.
A high performance score directly correlates with better user retention and lower bounce rates. Search engines favor fast, optimized sites, so Core Web Vitals audits are non-negotiable for organic growth.
Developers use Google Lighthouse to catch regressions during the build process. It identifies heavy scripts and unoptimized images instantly. For deeper insights into the challenges that developers face, read our guide on web performance challenges.
How to Use Google Lighthouse
There are multiple ways to access Google Lighthouse depending on your workflow. Most people just use the browser, but power users have other methods. You can choose the one that fits your current setup best.
We’ll outline the options and provide a step-by-step guide in the next section.
Using Lighthouse in Chrome DevTools
It’s the most common method. Lighthouse is built directly into the Chrome browser. You don't need to install anything extra to get started right away. Alternatively, if you prefer a more standalone experience, Google also offers an official Lighthouse Chrome extension that lets you run audits directly from your browser toolbar without opening DevTools.
Using Lighthouse via PageSpeed Insights
You can run Google Lighthouse remotely using PageSpeed Insights. The web-based tool runs the audit on Google's servers rather than your local device. It’s perfect for checking a web application when you aren't at your main computer.
Using the Node.js CLI
For automation, you can run Google Lighthouse from the command line. It’s useful for integrating Lighthouse audits into your CI/CD pipeline. It automatically makes website optimization part of your deployment routine.
How to Run a Google Lighthouse Audit (Step-by-Step)
Running an audit is straightforward. Follow these steps to generate your first Lighthouse report using Chrome browser tools. Note: for a live site that already generates traffic, Lighthouse scores alone should not be used to represent real-user experience. However, running the audit itself remains valid and useful for debugging specific pages or catching regressions after a deployment.
Open Developer Tools
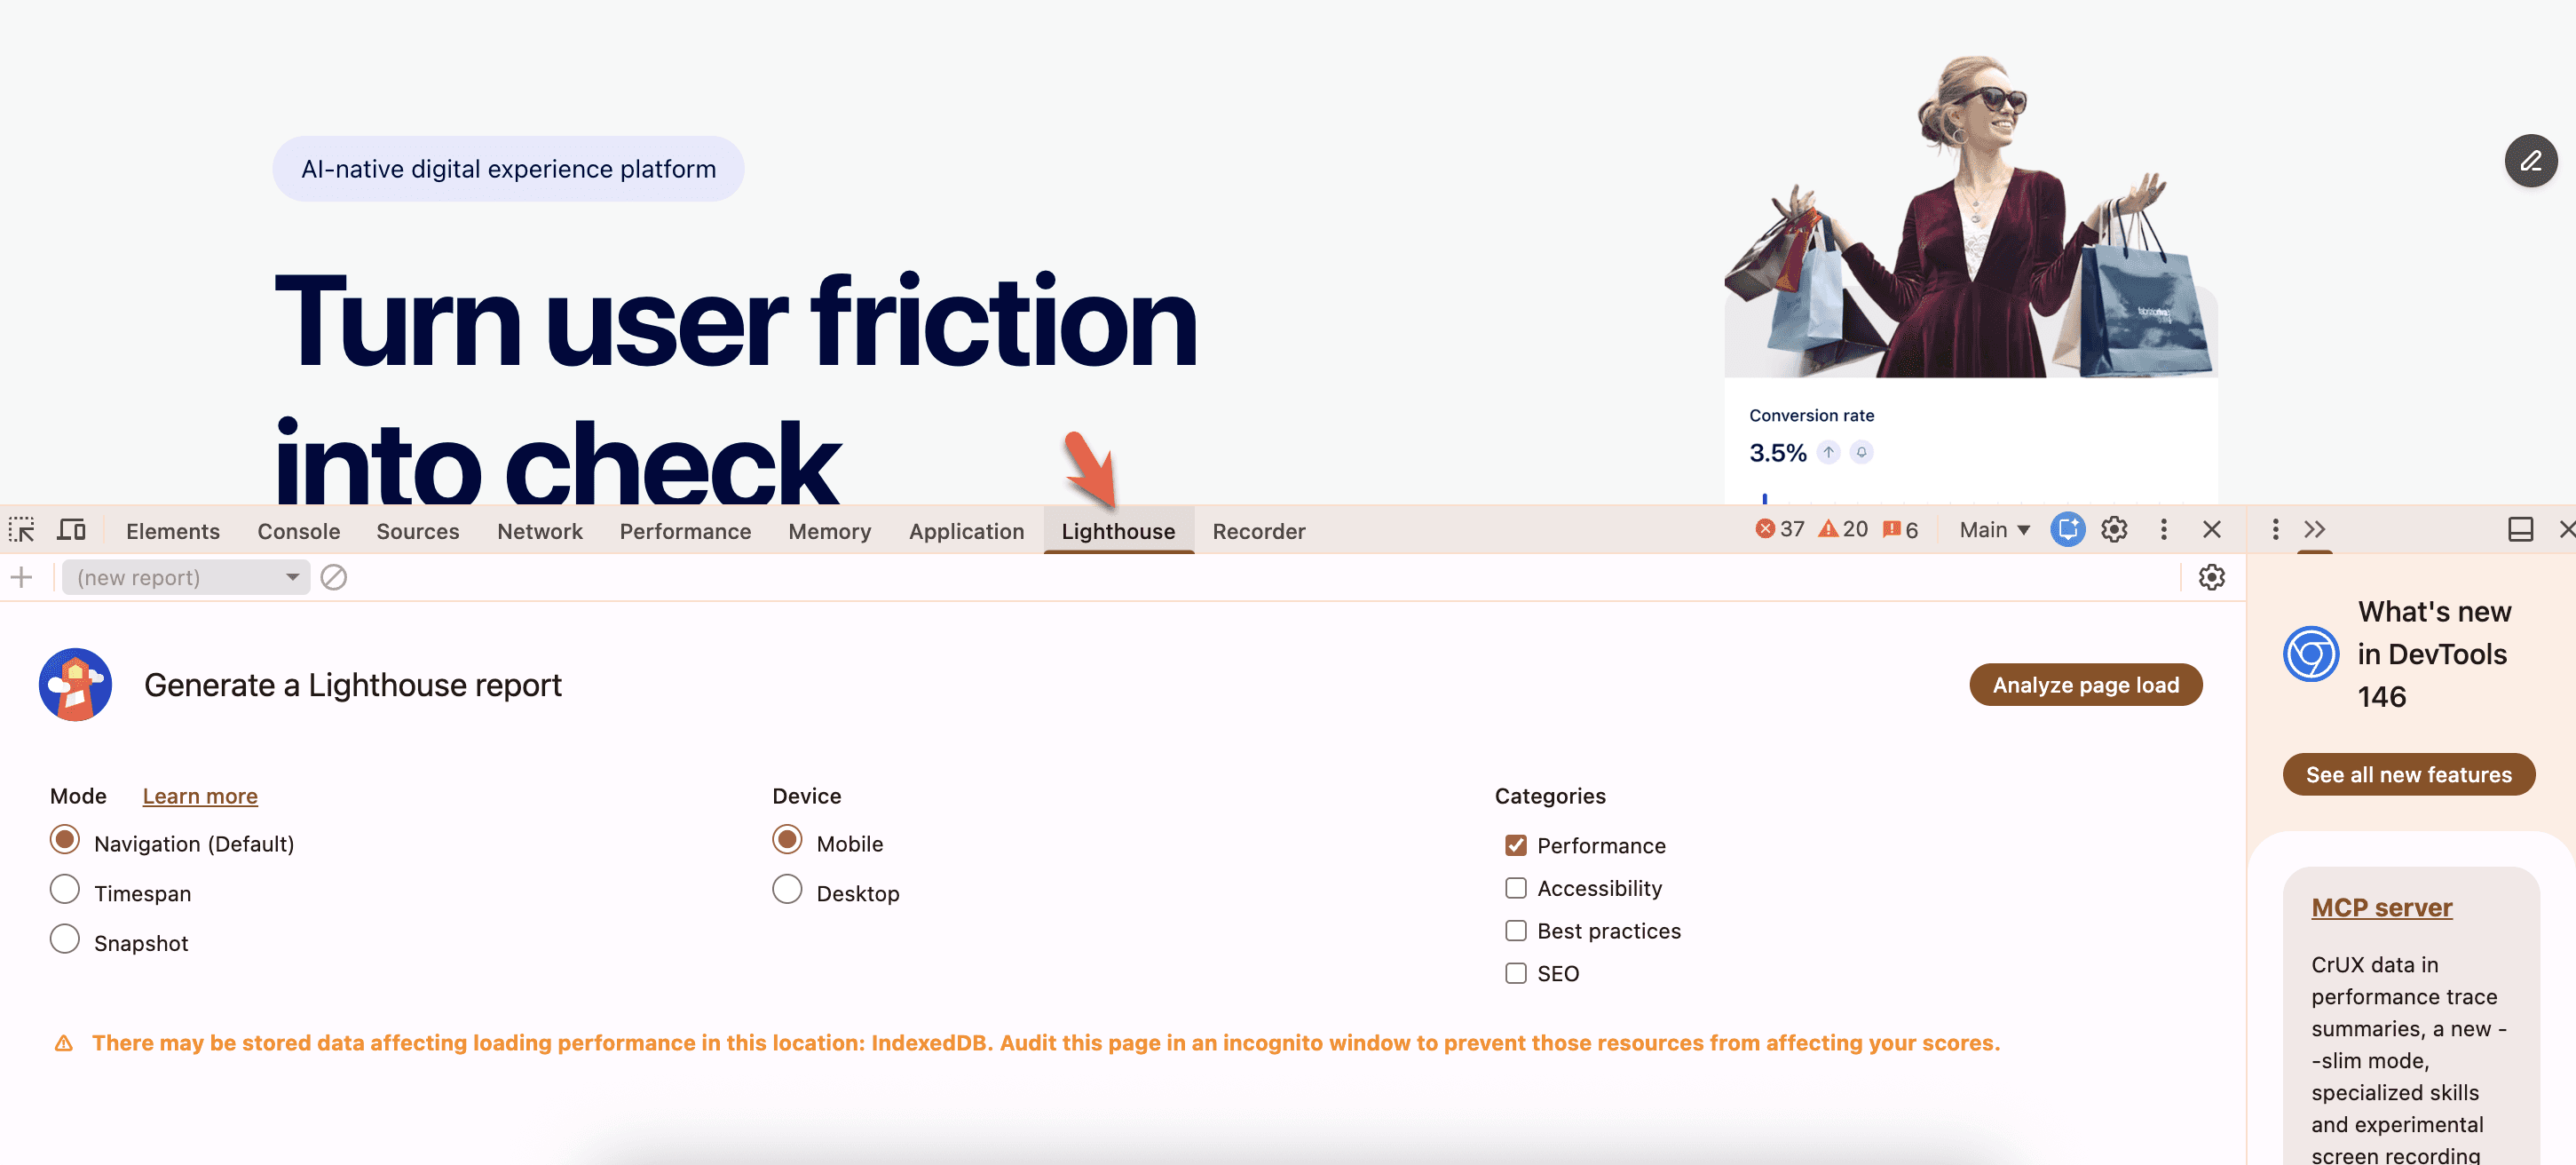
Right-click on any web page and select “Inspect” to open Developer Tools. Then, navigate to the “Lighthouse” section. The tab may be hidden under the “>>” button.
Choose Audit Categories
Select the categories you want to analyze, such as Performance or SEO. You can also choose between mobile and desktop device emulation. You don't have to check everything if you only care about speed today.
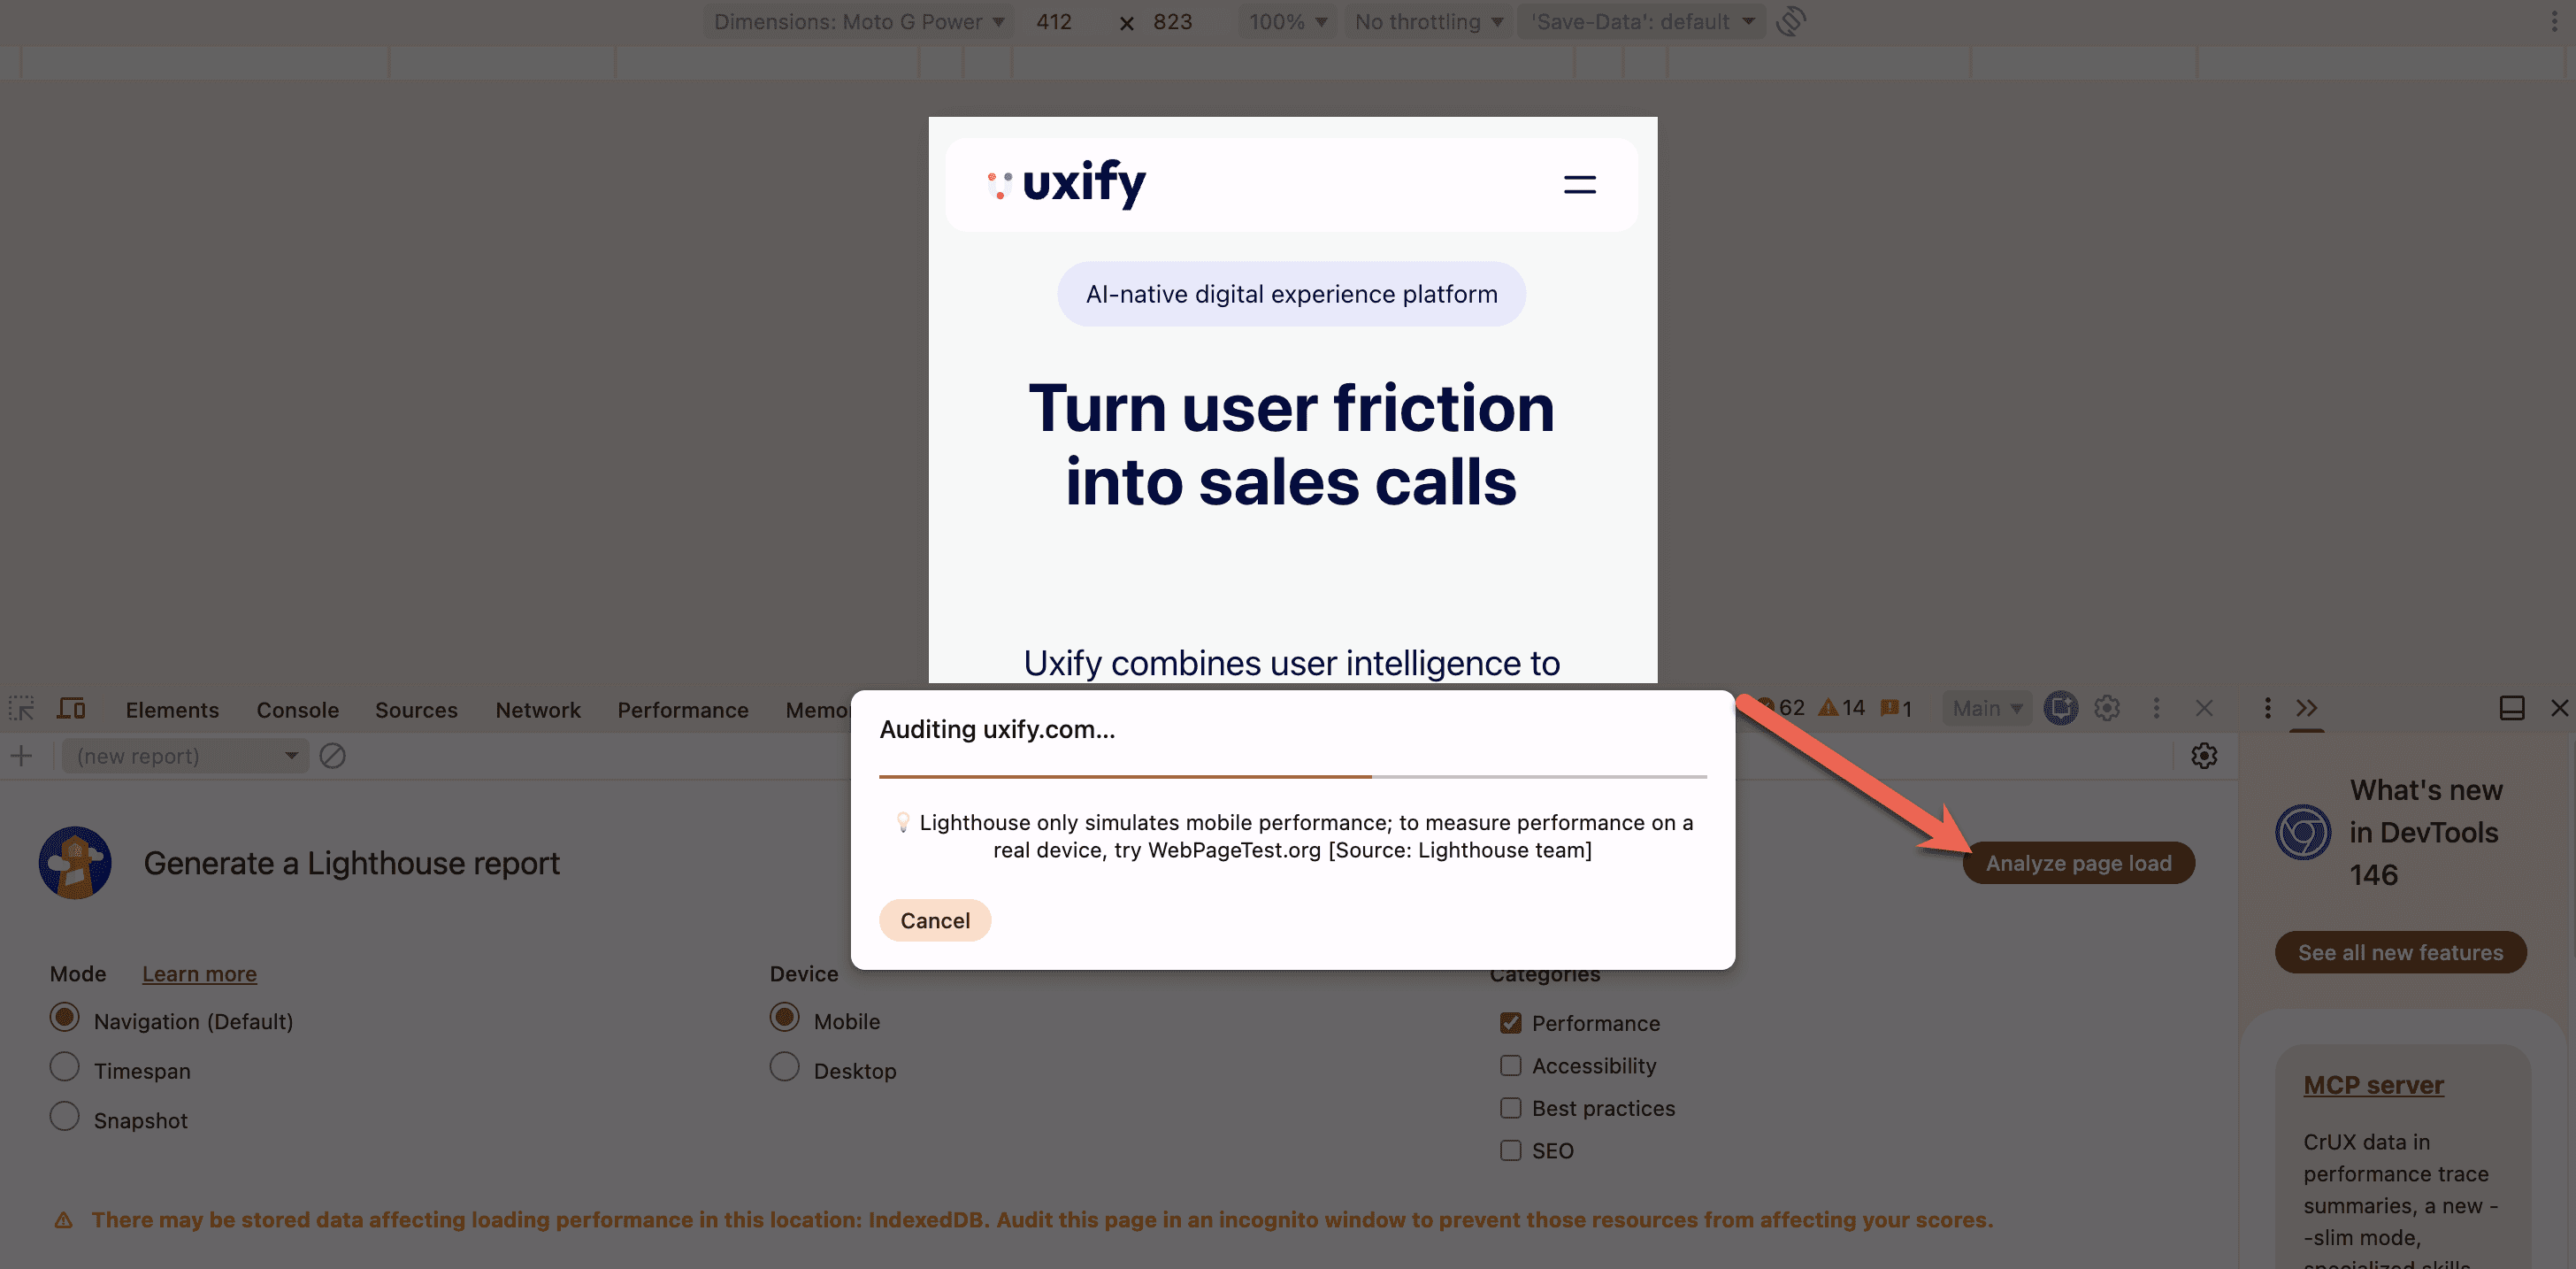
Run the Audit
Click “Analyze page load” to start the process. Google Lighthouse will reload the web page and record metrics.
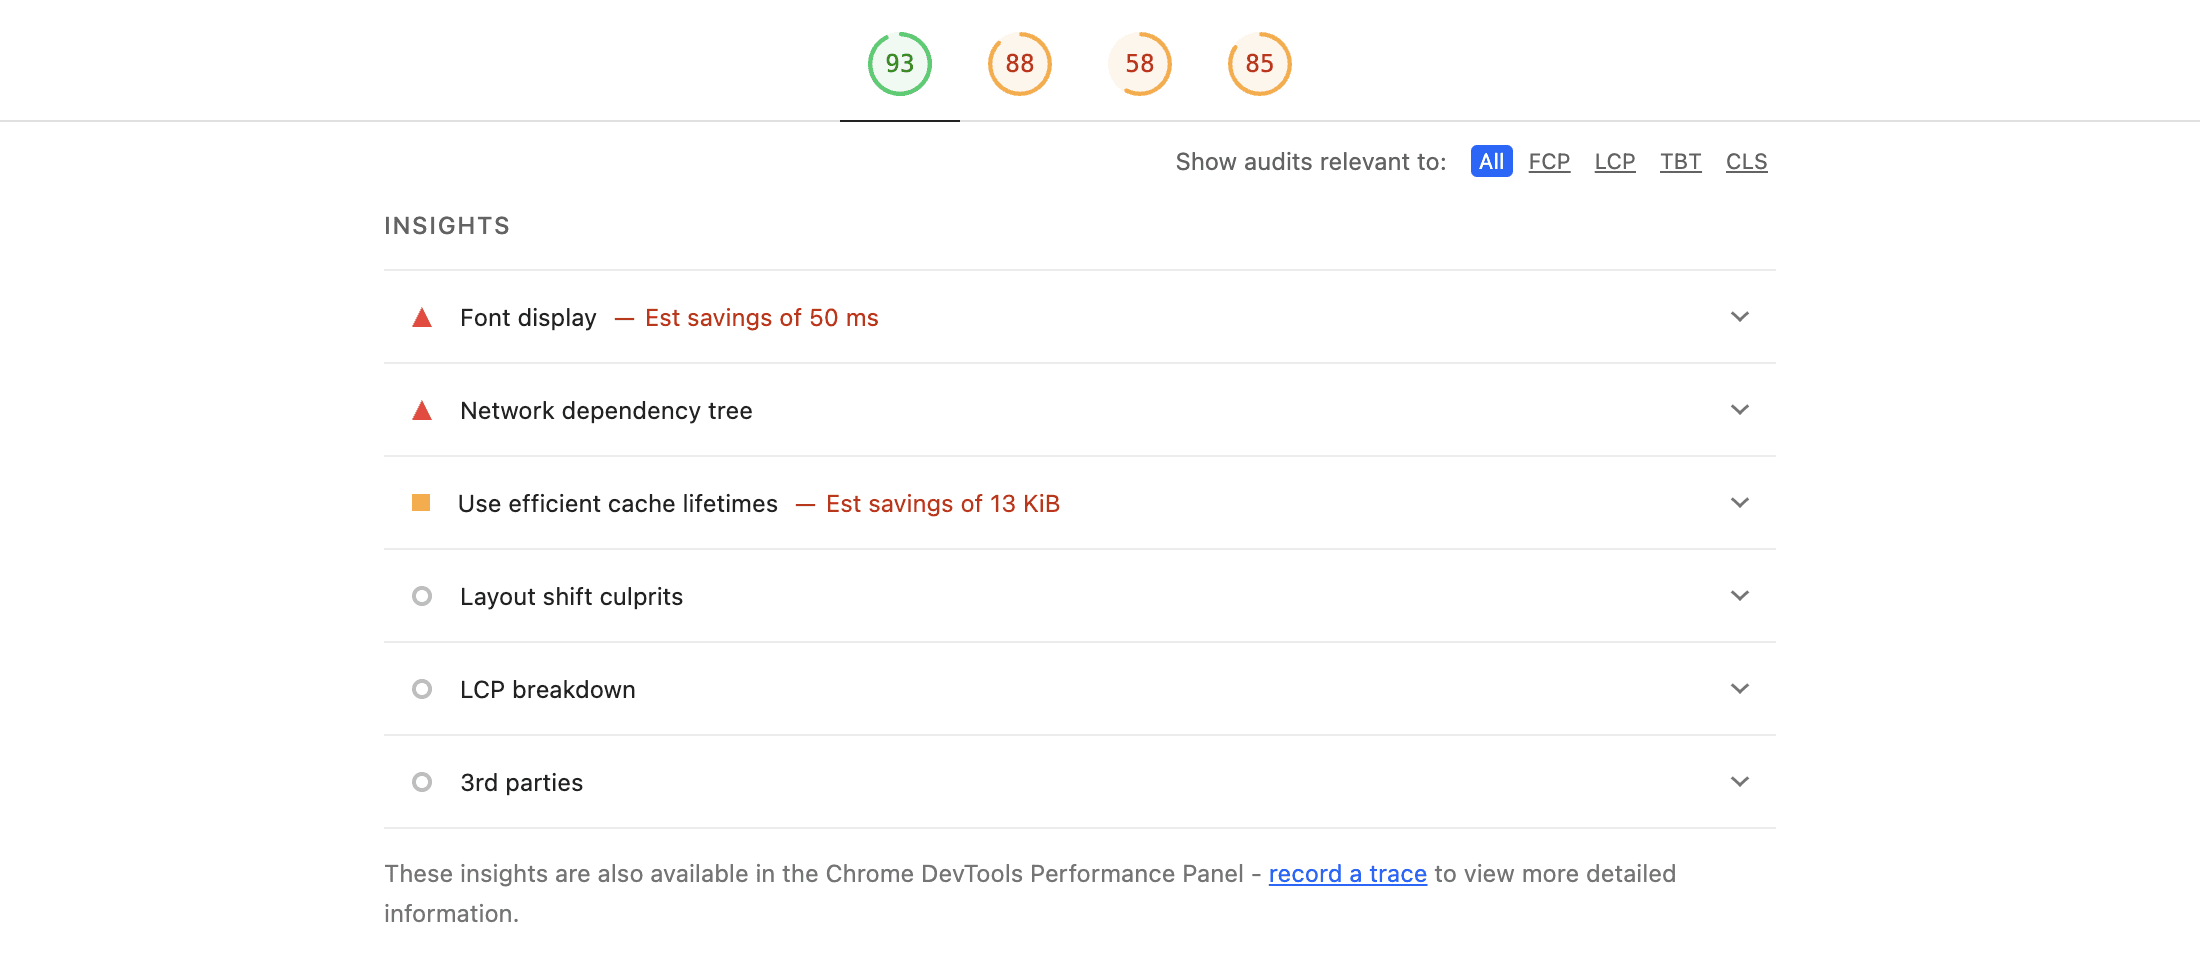
Interpreting the Report
Once finished, you’ll see your performance score at the top. Scroll down to see specific opportunities for improvement. The red alerts are your priority fixes, while the orange ones are nice-to-haves.
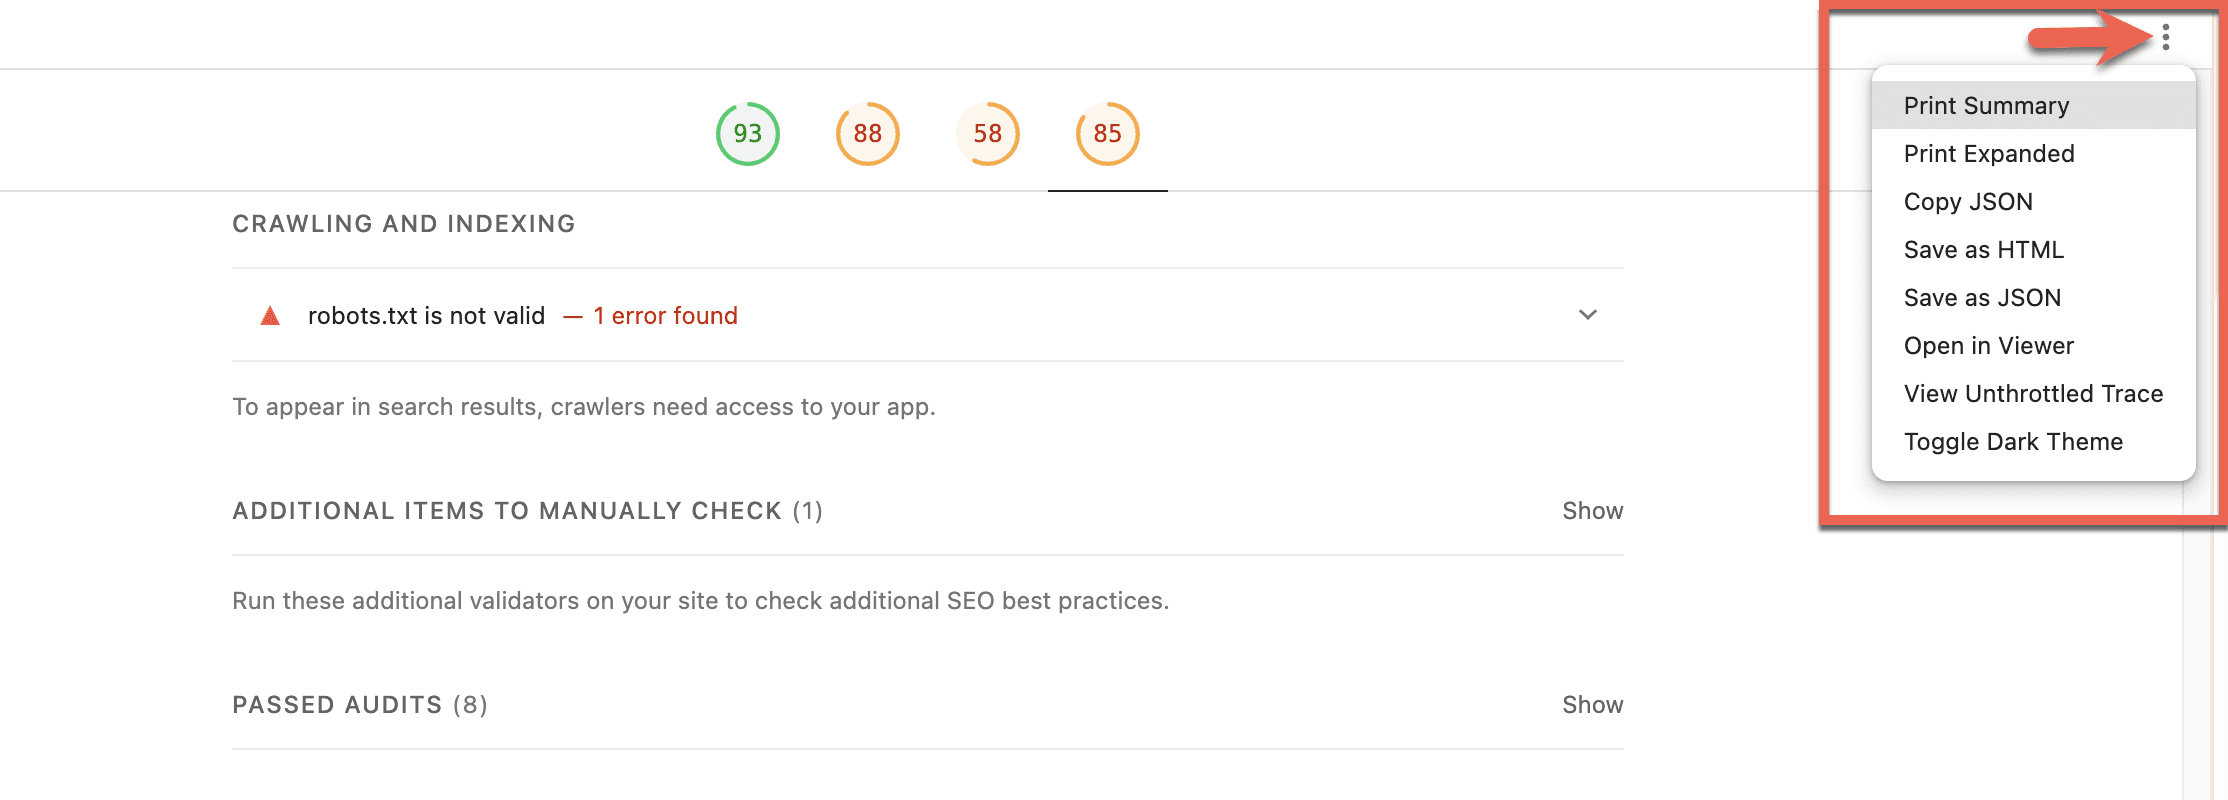
Exporting and Sharing Reports
You can save the Lighthouse report as a JSON or HTML file. It allows you to share the results with your team or clients easily.
All of the export and sharing options are found in the button with three vertical dots, near the top-right-hand side of the Lighthouse report.
How to Use Lighthouse to Improve Your Website
Getting a score is easy, but fixing it may not be. Google Lighthouse provides specific recommendations for every failed metric, but, as mentioned before, implementing these may require help from professional developers.
Prioritize performance fixes: Focus on the “Opportunities” section of the report. These suggestions estimate how much time you can save on page load. Fixing the biggest red warning first usually gives you the best quick win.
Enhance mobile experience: Mobile scores are often lower than desktop scores. Google Lighthouse simulates a slower 4G connection for mobile audits to reflect real-world conditions. You must optimize for these constraints if you want to capture mobile traffic effectively.
Technical SEO improvements: The SEO category checks for meta tags, descriptive link text, and crawlability. Google Lighthouse ensures your basic technical SEO is solid. If you ignore these basics, your content strategy won't matter much.
Monitor changes over time: Once the site is live, run Core Web Vitals audits instead of Lighthouse regularly to track your site's performance evolution. Consistency is key when maintaining a high-performing site.
To maintain these scores, consider establishing a web performance budget.
Common Issues Found by Google Lighthouse
Google Lighthouse often flags the same issues across most websites. To understand what to prioritize, it helps to look at these issues through the lens of the three Core Web Vitals — the metrics that matter most to both users and Google's ranking algorithm. Each one measures a different dimension of user experience, and each has its own set of common failure points.
Before diving in, here's how the Lighthouse performance score is actually weighted:
Metric | Weight |
|---|---|
Total Blocking Time (TBT) | 30% |
Largest Contentful Paint (LCP) | 25% |
Cumulative Layout Shift (CLS) | 25% |
First Contentful Paint (FCP) | 10% |
Speed Index (SI) | 10% |
LCP, CLS, and TBT account for 80% of your score — so that's where your effort should go first.
Largest Contentful Paint (LCP)
LCP measures how quickly the largest visible element on the page — typically a hero image or a main heading — renders in the viewport. Good score: under 2.5 seconds.
It's the hardest Core Web Vital to pass, and the most common culprits are:
Slow server response (TTFB). If the server takes too long to respond, everything else is delayed before it even starts. LCP problems frequently trace back here.
Render-blocking resources. CSS and JavaScript files that load before page content prevent anything from being painted. Moving non-critical scripts to load asynchronously or deferring them is usually the first fix.
Unoptimized images. Oversized or uncompressed images are one of the most common reasons LCP fails. Compressing images, using modern formats like WebP or AVIF, and adding a fetchpriority hint to the LCP image are high-impact fixes.
Cumulative Layout Shift (CLS)
CLS measures visual stability — specifically, how much page elements unexpectedly shift around while the page loads. A page that jumps around as it loads erodes user trust fast. Good score: under 0.1.
The most common causes are:
Images and embeds without defined dimensions. When the browser doesn't know how much space an image or video needs before it loads, it can't reserve space for it — causing everything below to shift down when it appears.
Dynamically injected content. Cookie banners, notification bars, or ads that load after the main content and push elements around are frequent offenders.
Web font loading. When a fallback font is replaced by a custom web font mid-render, the different character sizes can cause text blocks to shift. Using font-display: optional or preloading fonts helps prevent this.
Using tools like Google Tag Manager incorrectly — such as injecting elements above existing content — is a common source of CLS that often goes unnoticed until it's measured.
Interaction to Next Paint (INP) — and Why Lighthouse Uses TBT Instead
INP measures how quickly your page responds to user interactions like clicks, taps, and key presses across the entire page visit. Good score: under 200 milliseconds.
Here's an important distinction: Lighthouse cannot measure INP directly in a standard audit, because a page load test involves no user interactions. Instead, Lighthouse uses Total Blocking Time (TBT) as a lab proxy — it measures how long the main thread is blocked by heavy JavaScript tasks, which is the primary underlying cause of slow interactions. A high TBT score is a strong signal that real-world INP will be poor.
For accurate INP data, you need field data from PageSpeed Insights or Google Search Console, which captures real user interactions over time. The most common INP issues to address are:
Long-running JavaScript tasks. Scripts that monopolize the main thread block the browser from responding to user input. Breaking up long tasks is the most direct fix.
Heavy third-party scripts. Analytics, chat widgets, and ad scripts often run on the main thread and add significant interaction delay — especially on mobile.
Large DOM size. Pages with an excessive number of DOM elements take longer to process interactions, as the browser has more to recalculate with each update.
Limitations of Google Lighthouse
Lighthouse is a powerful diagnostic tool, but understanding what it can't do is just as important as knowing what it can. Most misinterpretations of Lighthouse results come down to treating a lab tool as if it were a real-user monitoring tool which it isn't.
A Good Score Doesn't Guarantee Good Field Data
This is the most important limitation to internalize. A page can score 95 in Lighthouse and still fail Core Web Vitals in PageSpeed Insights, because real users visit your site on a wide range of devices and network conditions that no lab simulation can fully replicate. Lighthouse tests against a fixed device profile and throttled connection, while your actual visitors may be on older Android phones on a patchy 4G signal. The gap between lab and field data can be significant, and a high Lighthouse score should never be read as confirmation that your real-user experience is good.
Scores Vary Between Runs
Lighthouse results are not perfectly consistent. Server response times, background CPU activity on your local device, and network conditions at the time of the test can all cause your score to shift between runs sometimes by several points. If you run an audit twice and get different results, that's expected behavior, not a bug. Always treat Lighthouse scores as directional rather than exact, and base optimization decisions on trends rather than single data points.
It Cannot Directly Measure INP
Since INP requires real user interactions to record, a standard Lighthouse page load audit which involves no interactions cannot measure it. Lighthouse uses Total Blocking Time (TBT) as a lab proxy for responsiveness, which is useful for identifying heavy JavaScript as a likely INP problem, but it is not a substitute for actual INP data. For that, you need field data from PageSpeed Insights or Google Search Console.
Single-Page Analysis Limitation
Lighthouse analyzes one page at a time, and most people audit their homepage, which is typically the most optimized page on the site. Product pages, blog posts with embedded video, and JavaScript-heavy dynamic pages frequently perform much worse, and you won't know unless you test them specifically. Auditing a large site page by page manually isn't realistic without scripted automation — which is why integrating Lighthouse into a CI/CD pipeline is recommended for teams managing sites at scale.
Doesn’t Replace Manual Audits
Lighthouse can produce false positives. A contrast warning might flag a design element that reads perfectly well in practice. An accessibility audit might miss context that only a human reviewer would catch. The report is a strong starting point, but it should inform a human decision — not replace one.
The good news is that Lighthouse's limitations don't have to leave you in the dark. For sites running on platforms like Shopify and WordPress, dedicated performance tools can handle continuous monitoring automatically — so you always have an accurate picture of how your site is actually performing, without having to rely solely on periodic lab audits.
Lighthouse vs PageSpeed Insights vs Uxify
People often confuse Google Lighthouse with PageSpeed Insights. They use the same engine but serve different purposes. Here’s how they stack up against each other:
Feature | Google Lighthouse | PageSpeed Insights | Uxify's Reality |
|---|---|---|---|
Data source | Lab data only | Lab and field data | Live real-user data |
Environment | Local device/Chrome browser | Google servers | Real visitor sessions, all browsers |
Data freshness | On-demand snapshot | 28-day rolling average | Live, up to 30 mins delay |
Browser coverage | Chrome only | Chrome only (CrUX) | All browsers including Safari |
Best for | Debugging local development | SEO and real user checks | Complete real-user performance monitoring |
Metrics | Performance score, accessibility, SEO | Performance score, Core Web Vitals | Core Web Vitals + engagement metrics (conversions, bounce rate, revenue) |
Google Lighthouse powers the audits in Chrome Developer Tools. PageSpeed Insights uses Lighthouse but adds real-world user data (CrUX). PageSpeed Insights is generally better for checking your live website's speed for SEO purposes. Lighthouse is better for web developers working on local code.
Uxify's Reality moves beyond diagnostics into live real-user monitoring. Where Lighthouse gives you a lab snapshot and PageSpeed Insights reflects a 28-day average, Reality shows you what's happening on your site right now and connects Core Web Vitals performance directly to engagement metrics like conversions and bounce rates. That combination of live performance data and business context is where measurement becomes actionable.

When to Move Away from Lighthouse?
Google Lighthouse is great during the early, developmental stages of your website. If there’s no or very little traffic to your website, lab tests are basically the only way to get some sort of user experience assessment.
Once you have enough traffic for field data to become statistically significant, that’s the time to move on to PageSpeed Insights for more accurate Core Web Vitals metrics. You’ll likely notice that the report is a little different from Lighthouse’s.
PageSpeed Insights will be more accurate as it uses data specifically coming from actual visitors to your site over the previous 28-day collection period. If Lighthouse didn't motivate you to fix UX issues, then data from PageSpeed Insights should. Focus on these Core Web Vitals metrics:
Largest Contentful Paint (LCP) under 2.5s,
Interaction to Next Paint (INP) under 200ms,
Cumulative Layout Shift (CLS) under 0.1.
Luckily, there are plenty of solutions, such as Navigation AI and INProve, that help you keep these metrics within range automatically while also providing valuable data from real user monitoring.
Frequently Asked Questions
What is a good Google Lighthouse score?
A performance score between 90 and 100 is considered good. A score between 50 and 89 needs improvement, while anything below 50 is poor.
How to improve Google Lighthouse scores?
Google Lighthouse scores can be improved by optimizing images, removing unused JavaScript, reducing render-blocking resources, and using fast, reliable hosting. In many cases, improving the way pages load and render has the biggest impact.
How is Lighthouse different from PageSpeed Insights?
Lighthouse is the testing engine itself and usually runs locally in Chrome or from the command line. PageSpeed Insights uses Lighthouse too, but it also adds real-user data, which gives a better picture of how your site performs for actual visitors.
How do I access Google Lighthouse?
Google Lighthouse can be accessed through Chrome DevTools (F12), the PageSpeed Insights website, or the command line.
How often should I run a Lighthouse audit?
That depends on where your site is in its lifecycle. During development and before launch, it is smart to run Lighthouse regularly, including in a CI/CD pipeline, to catch issues early. Once the site is live, Core Web Vitals data from PageSpeed Insights or Google Search Console should become the main source of truth, because it reflects real user experience. Lighthouse is still useful after launch, but more as a debugging tool than a long-term performance benchmark.
Is Google Lighthouse free to use?
Yes, Google Lighthouse is a completely free, open-source tool provided by Google.

" height="200.00000219726564px" id="j9Mmwfnw8" transform="translate(143.5 0)" width="479.5329973144531px"/><path d="M 0 15.944 C 0 7.139 7.154 0 15.98 0 C 24.804 0 31.959 7.138 31.959 15.943 L 31.959 59.637 C 31.959 68.442 39.113 75.58 47.938 75.58 C 56.763 75.58 63.917 68.442 63.917 59.637 L 63.917 15.944 C 63.917 7.139 71.071 0.001 79.897 0.001 C 88.721 0.001 95.875 7.139 95.875 15.944 L 95.875 56.095 C 95.875 82.51 74.413 103.923 47.938 103.923 C 21.462 103.923 0 82.51 0 56.095 Z" fill="rgb(59, 63, 91)" height="103.923px" id="KJCDMITFE" transform="translate(0 53)" width="95.875px"/><path d="M 0 15.943 C 0 7.138 7.154 0 15.979 0 C 24.804 0 31.958 7.138 31.958 15.943 C 31.958 24.748 24.804 31.886 15.979 31.886 C 7.154 31.886 0 24.748 0 15.943 Z" fill="rgb(252, 200, 0)" height="31.885999999999996px" id="q2K9EYOvZ" transform="translate(0 53)" width="31.95799999999963px"/><path d="M 0 15.943 C 0 7.138 7.154 0 15.979 0 C 24.804 0 31.958 7.138 31.958 15.943 C 31.958 24.748 24.804 31.886 15.979 31.886 C 7.154 31.886 0 24.748 0 15.943 Z" fill="rgb(63, 184, 126)" height="31.885999999999996px" id="bBya7XCj7" transform="translate(64 53)" width="31.95799999999963px"/><path d="M 0 14.171 C 0 6.344 6.359 0 14.204 0 C 22.048 0 28.407 6.344 28.407 14.171 C 28.407 21.997 22.048 28.342 14.204 28.342 C 6.359 28.342 0 21.997 0 14.171 Z" fill="rgb(229, 0, 106)" height="28.341999999999985px" id="WNzwBFOi7" transform="translate(34.5 128.5)" width="28.407000000000153px"/></g></svg>)