
Most CRO teams chasing performance improvements stop at Core Web Vitals. Green scores in PageSpeed Insights. LCP under 2.5 seconds. INP passing. CLS cleared. Done.
But passing CWV doesn’t guarantee a good user experience, or conversions. Why? Because “passing” means most users had an acceptable experience, but not all. These are percentile-based metrics, so a meaningful share of users, often 20–30%, are still having a poor one. And those users don’t see your site as fast - they see friction. Yet, modern RUM solutions rarely reflect that. More often than not CWV are not tied to business outcomes even if they influence them
Are you comfortable leaving that revenue behind? Probably not.
This is where agentic AI changes the equation. It connects performance, behavior, and revenue, monitors continuously, and acts on what actually moves the needle.
So if you’re already tracking CWV, that’s a good start. You’ve covered the baseline. But the real opportunity starts beyond it.
This article isn’t just about the metrics beyond Core Web Vitals. It’s about why they only matter once something is actively optimizing them.
And why that “something” is increasingly (and preferably) not human.

Why do Core Web Vitals miss most of your revenue problems?
Core Web Vitals measure technical page experience, such as loading speed, responsiveness, and visual stability. They're meaningful signals. A site with poor CWV scores is harder to rank and easier to abandon. But they were designed as ranking signals, not revenue signals.
Metric | Good | Needs Improvement | Poor |
LCP | ≤ 2.5s | 2.5s – 4.0s | > 4.0s |
INP | ≤ 200ms | 200ms – 500ms | > 500ms |
CLS | ≤ 0.1 | 0.1 – 0.25 | > 0.25 |
Google uses these industry-wide benchmarks as tiebreakers in competitive rankings. That's useful, but is by no means the whole picture.
CWV scores aren’t simple averages. They’re based on the 75th percentile of real user experiences. A page with an LCP of 2.3 seconds passes because at least 75% of users had a “good” experience. But that also means up to 25% of your users are having a significantly worse one. In a real-world scenario, if a large portion of your mobile visitors on slower connections are seeing 4.5 seconds, that’s your mobile conversion problem, masked by a passing score.
CWV also measure the page in isolation, not the journey. They capture performance at the page level or the origin, not across multi-step user flows. So a shopper hitting a slow product page, rage-clicking a broken filter, and abandoning before checkout won’t necessarily surface as a clear issue in your CWV scores. The metrics that capture that story live in behavioral and performance layers that most RUM solutions don’t connect to revenue at all.
There’s also an operational problem that makes CWV even harder to act on. Improving Core Web Vitals is rarely a quick win. It typically starts with CRO or marketing teams identifying a performance issue, noticing a drop in conversions, or spotting friction in user behavior. But they don’t own the fix. The actual work sits with engineering: refactoring code, adjusting scripts, optimizing assets, or reworking infrastructure. And that handoff introduces delay, while in the meantime the underlying issue continues to impact every session, every user, and every transaction.
So if Core Web Vitals only give you a partial picture, where does the real signal start to appear?
It starts upstream, before the page even begins rendering.
LCP and TTFB: why your loading score hides the real problem?
Why LCP is a lagging indicator
Largest Contentful Paint (LCP) is the Core Web Vital for loading performance. The benchmark is under 2.5 seconds, and most teams treat hitting that threshold as the end of the conversation.
It isn’t.
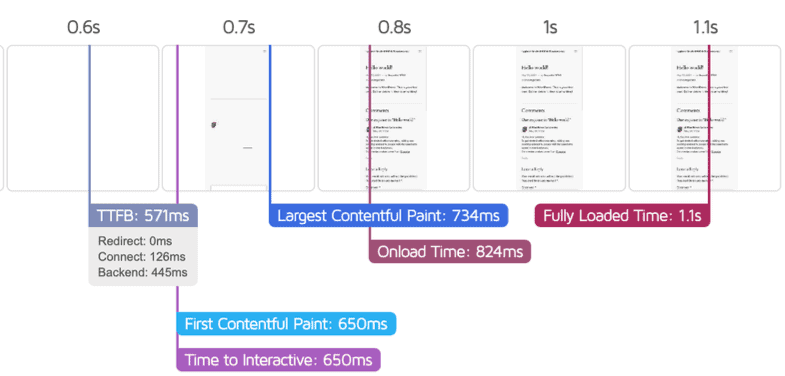
LCP tells you when the largest meaningful element of the page became visible. TTFB determines when that process even begins.
Beyond LCP: Why TTFB determines your real page speed
TTFB measures the time between a site visitor requesting a page and their browser receiving the first byte of data. Every render, every image, every interaction starts downstream of it. According to Google’s web.dev documentation, TTFB directly determines how fast LCP can possibly be, or in other words - a slow server guarantees a slow page, no matter how optimized your frontend is.
Source: Google
All of this shows that LCP isn’t something you optimize directly, but is determined by TTFB and everything that happens before the page even starts rendering. Research shows that every 100ms improvement in TTFB correlates with a 1–2% increase in conversion rate. For a store doing $500K per month, a 500ms reduction translates into around $25,000 to $50,000 in additional monthly revenue.
And yet, despite the measurable impact it can have on revenue, TTFB is rarely treated as a CRO lever. It’s still seen as a backend metric, even though it directly controls how fast users can convert. The challenge isn’t understanding this. It’s acting on it.
TTFB fluctuations don’t happen in clean, reportable intervals. They vary constantly by geography, device, traffic source, and infrastructure load. Which means that by the time a TTFB spike shows up in a report, the conversion impact has already been accumulating for hours.
Source: Google
INP: why responsiveness matters more than people realize?
Speed gets users to the experience. But speed alone doesn’t guarantee conversion. What happens next, i.e. how the site responds to user interactions, is where the next layer of metrics becomes far more revealing than anything Core Web Vitals alone can show.
What INP actually measures
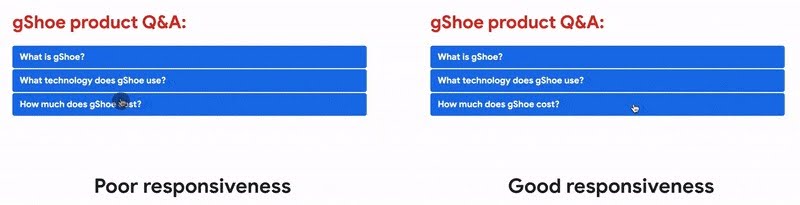
Interaction to Next Paint (INP) replaced First Input Delay as Google's official responsiveness metric in 2024. Unlike its predecessor, which only measured the very first interaction on a page, INP measures every interaction throughout a session - every click, tap, and keypress - and reports the worst one. That makes it a far more honest signal of how your site actually feels during real use.
Source: Google
For conversion optimization, the distinction is critical. An add-to-cart button with a 450ms INP doesn't feel broken, it just feels heavy. Users don't bounce immediately. They hesitate, they click again, they question the checkout flow. Some 26% of mobile sites still fail the 200ms INP threshold, making it a more persistent problem than FID ever was.
And when something feels slow or unresponsive, users show it in how they behave.
Beyond INP: How rage clicks expose hidden conversion friction
INP data tells you how slow interactions are. Rage clicks tell you where users are breaking. The two signals belong together. Rage clicks, or rapid repeated clicks on the same element, happen when a button didn't respond, didn't go where the user expected, or triggered a delay just long enough to create doubt. Rage clicks consistently correlate with higher bounce rates and lower conversion rates. They're not a UX curiosity, but a mark for the exact points in a funnel where sales die.
But even fast, responsive interactions don’t guarantee trust and sales. Conversions depend heavily on visual stability and predictability too.
CLS: the trust metric, or why scroll depth tells you how bad it really is?
What CLS actually measures
Cumulative Layout Shift (CLS) is the third Core Web Vital, and probably the most underestimated. LCP and INP are about speed; CLS is about predictability - whether your page stays visually stable while it loads, or if your visitors are experiencing jumpy buttons, text that moves, images scaled out of proportion.
Layout instability tends to peak at exactly the moments that matter most: a promo banner loads late and pushes the add-to-cart button down, a cookie notice appears and shifts the checkout form, a payment widget renders and moves the "Place Order" button half a second after the user clicks it. The user misses the click, hits the wrong element, or simply loses trust in the transaction, ultimately damaging your bottomline.
Layout instability is also one of the hardest issues for human teams to track consistently. It often appears only under specific conditions: certain devices, third-party scripts, or timing sequences.
Sites achieving good CLS alongside LCP and INP see on average 24% lower bounce rates compared to sites with poor Core Web Vitals.
Beyond CLS: How scroll and session depth expose conversion blockers
A passing CLS score doesn't mean your layout is stable throughout a session, though; it only measures the aggregate shift score at load time. To diagnose where instability is affecting users, we look at scroll depth - how far users actually progress down the page. But to understand the business impact, session depth becomes the critical metric: how many pages users continue to explore after that experience.
On their own, each of these only paints a partial picture. Combined, they point directly at the problem and at the revenue it costs.
If a site’s scroll depth data shows 60% of product page visitors stopping well above the add-to-cart button, the two signals together suggest something is breaking their journey: a late-loading element shifting content, or a widget disrupting the reading flow.
Research, based on 90 billion sessions across 6,000 websites, indicates that increasing session depth by 10% or more correlated with a 5.4% average uplift in conversions.
In practice, the root cause for CLS or session depth issues is rarely visible in your core codebase. Most originate in third-party scripts layered on top of it:
Late-loading ads without reserved space
Cookie banners injected without allocated containers
Chat widgets appearing after render
Retargeting pixels triggering reflows
These components update independently, which means layout instability can regress silently and only appear under specific conditions, persisting until it shows up in the metrics as reduced scroll progression, lower session depth, or ultimately - a drop in conversions. It’s not something a weekly audit or a PageSpeed score will reliably catch.
How can AI agents monitor these metrics better than any human team?
Here's the core structural problem with metrics-driven optimization: the signals that matter most (rage clicks, scroll depth drops, TTFB spikes, INP regressions) don't happen at a scheduled time. They happen continuously, across thousands of sessions, at different rates by device, traffic source, geography, and time of day. No human team can watch all of that at once.
AI agents can. And crucially, they don't just watch - they act.
Uxify’s platform watches 3,000+ signals in real time, connecting behavior, performance, and revenue, with a set of CRO agents working underneath to detect and act the moment something breaks.
How the CWV Anomaly agent fixes LCP, INP and CLS issues on the spot
As mentioned above, Core Web Vitals don’t fail all at once. They regress gradually, often triggered by small changes, so issues rarely show up immediately in dashboards. And by the time they’re detected, the impact on conversion has already started to accumulate.
Because CWV signals fluctuate constantly across sessions, devices, and traffic sources, even a passing score can hide localized regressions affecting specific user segments. And without continuous monitoring, these issues can persist unnoticed while revenue quietly declines.
Launching soon, Uxify’s CWV Anomaly agent operates at that detection layer. It monitors LCP, INP, and CLS across every session in real time, compares them against dynamic baselines, and flags deviations the moment they appear. Instead of relying on periodic audits or delayed reports, it surfaces both the regression and its likely source before it compounds into a conversion problem. It will then suggest a fix and implement it upon your approval, taking care of the entire process automatically.

How Navigation AI closes the perceived speed gap
A page can technically load in three seconds and feel instant, or load in 1.5 seconds and feel slow, depending on when critical content appears and how long the screen remains blank. Site visitors don’t experience metrics; they just experience the website.
Navigation AI addresses this at the perception layer. Instead of waiting for a click, it predicts where a visitor is likely to go next and preloads that destination in advance. When the user clicks, the page is already in the browser cache. From their perspective, it loads instantly. Not just faster, but ahead of time.
This isn’t theoretical. Google pioneered this through the Speculation Rules API in Search, establishing predictive loading as an emerging standard for perceived performance.
Shopify Platinum agency and Uxify partner MindArc experienced this combined impact first hand. For one of their ecommerce clients:
TTFB dropped from 0.7s to 0.2s
LCP improved by 53%
Pageviews increased by 56%
Not from a server upgrade, but from preloading the right pages before users asked for them.
That result points to something most teams miss: perceived load speed can be optimized independently of raw server performance and often with a larger impact on engagement and revenue.
How INProve connects interaction friction to conversion loss
Even when interaction issues are identified, acting on them in time is the real challenge. Which interaction issues matter most? Where are they affecting revenue? And what should be fixed first?
INProve operates at that decision layer. It continuously maps interaction-level friction to conversion impact, surfaces where performance is actively costing revenue, and provides a clear path from diagnosis to resolution. Instead of treating responsiveness as a technical metric, it turns it into a prioritized revenue lever.
The QuintoAndar case study demonstrates the impact: INP reduced by 80%, conversions up 36%, giving the team both the technical cause and the behavioral proof, in one place.
How the Tab Refocus agent helps prevent session drop-off
Not every lost conversion is the result of friction. Many are simply interrupted.
Users drop off mid-session for reasons that have nothing to do with the experience itself: distractions, context switches, or competing tabs. But from a measurement perspective, these sessions often look identical to failed conversions.
The problem is that most systems treat abandonment as a fixed outcome, while in reality many of these sessions are still recoverable, but only within a narrow and unpredictable window.
The Tab Refocus agent monitors these interruptions as they happen, identifies high-intent sessions that were left unfinished, and uses subtle visual cues to bring users back at the right moment. Instead of viewing drop-off as the end of the journey, it reframes it as a delayed conversion opportunity. Which adds a new layer to optimization: not just preventing loss, but actively recovering it.
How Ask Uxi functions as the intelligence layer across performance, behavior, and revenue
At the center of this sits Uxi, the diagnostic intelligence layer across the entire system. Instead of digging through dashboards to figure out why mobile conversions dropped on Friday, teams can ask a plain question and get an answer grounded in real session data. “Why did checkout completions drop 18% this weekend?” turns from a two-day investigation into a five-minute conversation.
This shifts how teams interact with data entirely. Instead of navigating tools, they access understanding directly, across performance, behavior, and revenue signals in one place.
This is where the connection between performance metrics and agentic CRO becomes concrete. You can’t optimize what you can’t see. And you can’t act fast enough on what you can only see after the fact. Agentic website optimization closes all these gaps simultaneously.
The metrics you're not watching are costing you more than you think
Core Web Vitals are the floor, not the ceiling. Passing them puts you in the game. It doesn't mean you're winning.
The sites that win in 2026 are the ones that connect performance signals to behavioral signals, and behavioral signals to revenue impact. And then act on that connection in real time, not in a quarterly audit, not after the next CRO sprint, but continuously, automatically, with agents doing the monitoring and the initial resolution, while human teams focus on strategy and judgment.
TTFB that's 400ms slower than your competitor is bleeding conversions at a rate you can calculate. Rage clicks on a broken checkout element are telling you exactly where sales are dying. Scroll depth drops above your CTA are showing you that the CTA isn't being seen. INP regressions after deployments are making your interactions feel broken before anyone files a bug report.
These aren't abstract metrics. They're revenue signals. And in 2026, the teams acting on them with AI agents aren't just optimizing faster. They're compounding improvements that manual programs can't match and impacting revenue in an unprecedented way.
Uxify's AI CRO agents (launching soon) are built around exactly these signals: continuous monitoring, automatic detection, and real-time action across every metric covered in this article.
Frequently Asked Questions
Do the same metrics matter for every type of business?
Not equally. For ecommerce teams, TTFB and INP on product and checkout pages carry the highest revenue weight because a slow add-to-cart interaction costs sales directly. For SaaS teams, the critical signals shift to INP on trial signup flows and scroll depth on pricing pages, where users are evaluating before committing. Agencies face a different problem entirely: scale. Monitoring TTFB spikes, INP regressions, and rage click clusters across 10 or 20 client sites simultaneously isn't viable with manual tools. The metrics themselves don't change. But which ones to prioritise, and how to act on them, differs by business model.
How quickly do AI agents surface problems after they appear?
Uxify's agents detect signal deviations within minutes of them appearing, not days. A TTFB regression following a server configuration change, a rage click cluster on a newly deployed checkout button, or a CLS shift caused by a third-party script update all trigger detection in the same session window they occur in. The lag that makes human monitoring expensive, that gap between a regression appearing and someone noticing it in a weekly report, is what agentic monitoring removes entirely.
Do AI agents make changes to my site automatically, or does a human stay in control?
Uxify's agents surface issues and initiate resolution but significant changes require human sign-off before they're applied. The autonomy is in the detection and the diagnostic work, not in unchecked execution. Think of it as the agent doing the monitoring and the groundwork that would otherwise consume your team's time, while human judgment stays in the loop for decisions that affect site behaviour at scale.

" height="200.00000219726564px" id="j9Mmwfnw8" transform="translate(143.5 0)" width="479.5329973144531px"/><path d="M 0 15.944 C 0 7.139 7.154 0 15.98 0 C 24.804 0 31.959 7.138 31.959 15.943 L 31.959 59.637 C 31.959 68.442 39.113 75.58 47.938 75.58 C 56.763 75.58 63.917 68.442 63.917 59.637 L 63.917 15.944 C 63.917 7.139 71.071 0.001 79.897 0.001 C 88.721 0.001 95.875 7.139 95.875 15.944 L 95.875 56.095 C 95.875 82.51 74.413 103.923 47.938 103.923 C 21.462 103.923 0 82.51 0 56.095 Z" fill="rgb(59, 63, 91)" height="103.923px" id="KJCDMITFE" transform="translate(0 53)" width="95.875px"/><path d="M 0 15.943 C 0 7.138 7.154 0 15.979 0 C 24.804 0 31.958 7.138 31.958 15.943 C 31.958 24.748 24.804 31.886 15.979 31.886 C 7.154 31.886 0 24.748 0 15.943 Z" fill="rgb(252, 200, 0)" height="31.885999999999996px" id="q2K9EYOvZ" transform="translate(0 53)" width="31.95799999999963px"/><path d="M 0 15.943 C 0 7.138 7.154 0 15.979 0 C 24.804 0 31.958 7.138 31.958 15.943 C 31.958 24.748 24.804 31.886 15.979 31.886 C 7.154 31.886 0 24.748 0 15.943 Z" fill="rgb(63, 184, 126)" height="31.885999999999996px" id="bBya7XCj7" transform="translate(64 53)" width="31.95799999999963px"/><path d="M 0 14.171 C 0 6.344 6.359 0 14.204 0 C 22.048 0 28.407 6.344 28.407 14.171 C 28.407 21.997 22.048 28.342 14.204 28.342 C 6.359 28.342 0 21.997 0 14.171 Z" fill="rgb(229, 0, 106)" height="28.341999999999985px" id="WNzwBFOi7" transform="translate(34.5 128.5)" width="28.407000000000153px"/></g></svg>)