
What is behavioral analytics?
At its core, behavioral analytics is the process of collecting and analyzing behavioral data to understand how users interact with the website, app, or product. Instead of focusing only on numbers (like pageviews or bounce rate), behavioral analytics looks at actions – what users do, how they navigate, and where they struggle.
The distinction matters more than it seems at first glance. A pageview tells you someone arrived, while behavioral analytics tells you what they did when they got there: which element they clicked first, how far they scrolled before losing interest, whether they hesitated before the add-to-cart button, and exactly where they gave up. That granularity is what turns a traffic report into a concrete optimization roadmap, backed by real user data.
Understanding real user behavior
The biggest advantage of behavioral analytics is that it reveals real user behavior, enabling you to make data-driven decisions. Rather than getting information from surveys or opinions, you observe:
Clicks and taps
Scroll depth
Navigation flows
Time spent on elements
Repeated user actions
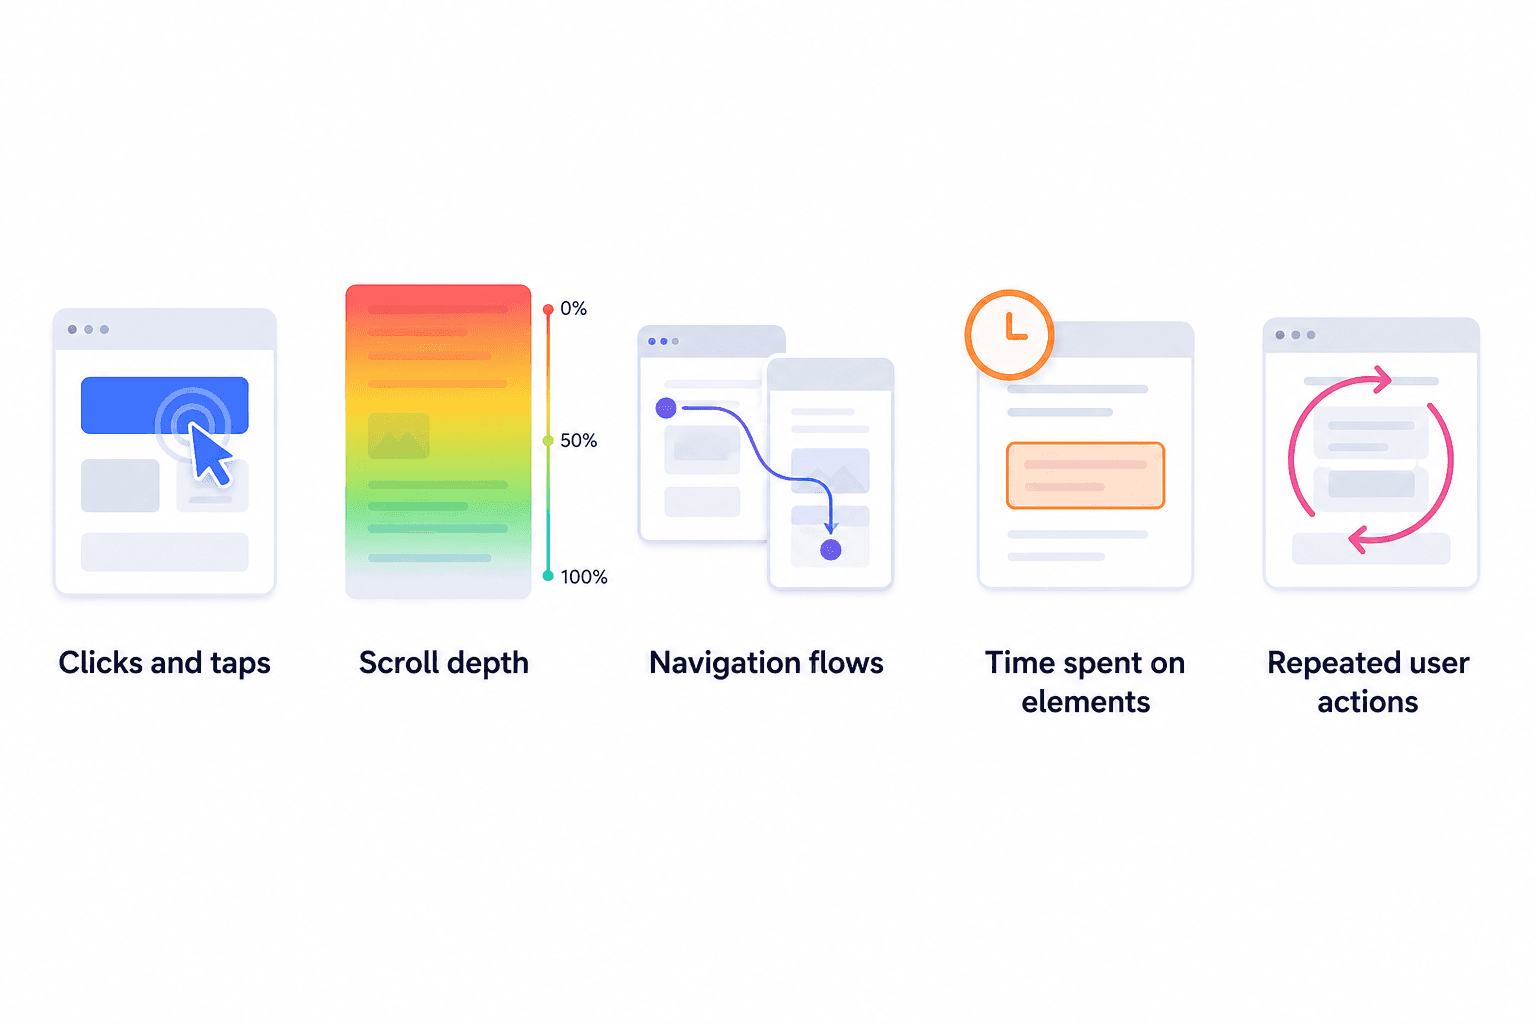
Each of these signals captures something a survey never could: the unfiltered, unconsidered reaction of a real user in a real moment of intent.
This helps teams identify patterns in how online stores’ visitors interact with the website and products, revealing what works and what doesn’t. You begin to understand what users actually want instead of what they say they want, how different segments behave, and where friction exists.
That’s the power of behavioral analytics – it turns invisible behavior into visible insights.
Improving digital experience
A better understanding of customer behavior leads directly to insights on how to create better experiences for them. Without this knowledge, customers might seem like random wanderers who just somehow end up leaving your page without a clear reason.
When you analyze behavioral data, you can:
Remove unnecessary steps
Simplify navigation and how fast it works
Improve page layouts
Reduce confusion
Session recordings often reveal a clear pattern: users pause at a multi-field checkout form and then abandon the process. The issue rarely requires a full redesign of the purchase flow. In many cases, reducing the number of fields from eight to four removes enough friction to improve completion rates.
Behavioral analytics makes these patterns visible and actionable. Instead of relying on assumptions, optimization decisions are based on observed user behavior. The result is a smoother, more intuitive checkout experience aligned with real user interactions, not an imagined average.
Increasing conversions
Behavioral analytics is not just a tool to entertain your curiosity about user behavior. Ultimately, it’s a growth tool, helping you turn acquired data into significant changes that boost your conversions. The moment you stop treating behavioral data as reporting and start treating it as a decision-making input, the ROI becomes concrete: fewer abandoned carts, longer engagement sessions, higher funnel completion rates.
By understanding how customers engage with your product, you can fix key moments of your website journey. From browsing troubles, through conversion bottlenecks, to onboarding improvements and retention - these issues can all surface from your behavioral analytics. That’s why behavioral analytics is now essential for product teams, marketers, and UX designers alike.
How do behavioral analytics work?
Understanding what behavioral analytics is, though, is different from understanding how it actually produces results. The real value comes from the steps behind it - turning raw data into patterns, and patterns into clear actions.
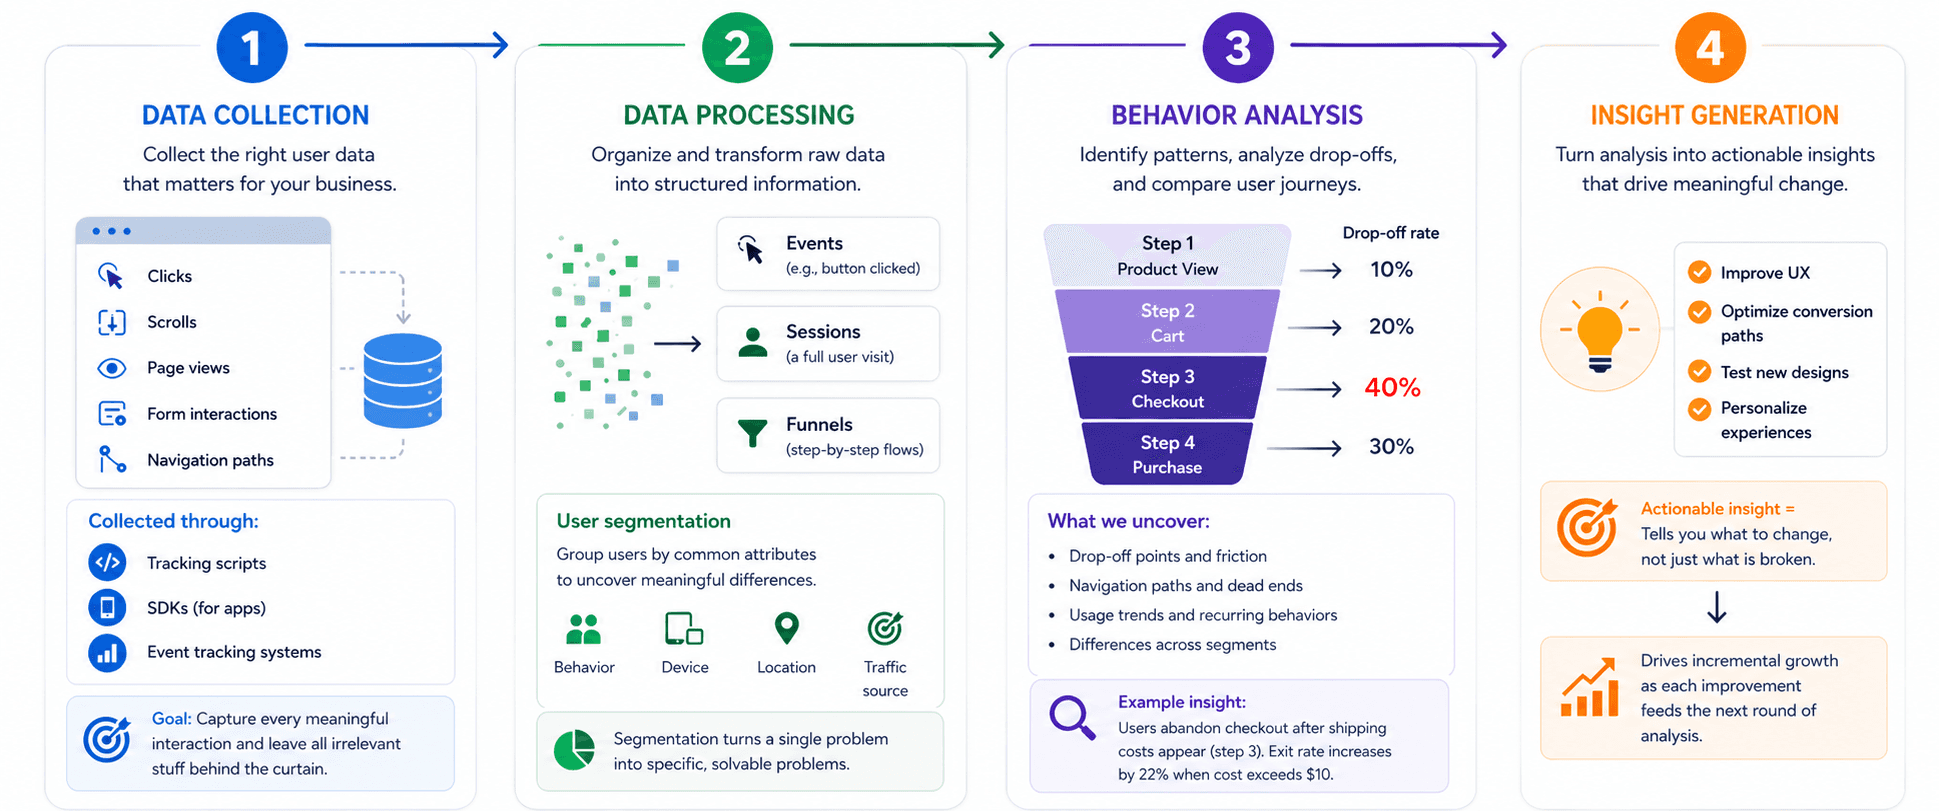
Data collection
Everything starts with data collection. Good behavioral analytics isn't about collecting every single piece of data - it’s about collecting the right kind of data for your business. Behavioral analytics tools track user activity, including clicks, scrolls, page views, form interactions, and navigation paths, but ultimately it’s up to you to decide which events are worth tracking.
A team that tracks 200 events and acts on none is not doing behavioral analytics; they're doing data hoarding. Effective data collection is selective and intentional, mapped directly to the questions the team is trying to answer.
This user data is collected through:
Tracking scripts
SDKs (for apps)
Event tracking systems
The goal is simple: capture every meaningful interaction and leave all irrelevant stuff behind the curtain. Accurate data on the right issues is what enables improvements with a significant impact on your conversions.
Data processing
Next, the system organizes and processes that data. To get meaningful analysis, you need to group the data and turn it into understandable information. Without this, even the most important aspects of data might look like a random mess that you will not be able to interpret correctly.
Raw behavioral data is transformed into structured insights:
Events (e.g., button clicked)
Sessions (a full user visit)
Funnels (step-by-step flows)
At this stage, user segmentation typically happens. Users are grouped based on commonalities such as behavior, device, location, and traffic source. Segmentation is where behavioral analytics starts earning its keep. A 40% drop-off rate at checkout looks like a single problem until you segment it and discover that mobile users from paid search are abandoning at 70%, while desktop users from organic convert at 65%. Those aren't the same problem, i.e., they don't have the same solution.
Behavior analysis
Now comes the core, i. e., behavioral analysis. Teams use it to identify patterns in behavior, analyze drop-offs, study navigation paths, and compare user journeys. You begin to see usage trends and recurring behaviors across users.
For example, users abandon checkout after shipping costs appear because that’s an additional amount to the cost that they already had in their mind. This is a textbook behavioral trigger: the user wasn't surprised by the product price but by the gap between what they saw in the cart and what they're seeing at checkout. Behavioral analytics surfaces that exact moment.
Another pattern you might see is that mobile users bounce off more often than desktop users. You can presume this is happening because they are probably struggling with navigation menus due to poor mobile optimization. Or you can notice new users skipping onboarding steps - a clear indication that the whole process is too complicated with too many steps. Both are problems that look invisible in aggregate traffic data and become obvious the moment you run a behavioral analysis segmented by device and user type.
Insight generation
Finally, behavioral analysis leads to generating insights that can later be translated into action. “Actionable”, albeit overused, in this case has a very specific meaning: an insight is actionable if it tells you what to change, not just what is broken. "Users are dropping off" is an observation. "Users are dropping off after the shipping cost is revealed on step 3 of checkout, and the exit rate increases by 22% when the cost exceeds $10" is an actionable insight. Teams use findings from behavioral analysis to:
Improve UX
Optimize conversion paths
Test new designs
Personalize experiences
When used well, behavioral analytics turn from a simple reporting tool to a decision-making engine - one that drives incremental growth as each improvement feeds the next round of analysis.
That four-stage process is the same regardless of which analytics discipline you're operating in. But behavioral analytics and traditional web analytics run that process very differently, and mixing the two is one of the most common reasons teams end up with data they can't use.
Behavioral analytics vs web analytics
Many teams confuse behavioral analytics with traditional web analytics. While they overlap, they serve different purposes.
Feature | Behavioral analytics | Web analytics |
Focus | User actions and behavior | Traffic and metrics |
Data type | Behavioral data | Aggregated data |
Insight level | Deep, qualitative + quantitative | High-level quantitative |
Tracks | Clicks, scrolls, sessions, flows | Pageviews, sessions, bounce rate |
Tools | Heatmaps, session replay, funnels | Google Analytics, dashboards |
Goal | Understand why users behave a certain way | Understand what is happening on-site |
Use case | UX optimization, conversion improvement | Traffic analysis, reporting |
To summarize, web analytics tells you what happened, and behavioral analytics tells you why it happened. Both are valuable, but behavioral analytics is what drives real optimization.
With that distinction clear, it's worth going one level deeper: behavioral analytics isn't a single method. It breaks into four distinct types, each capturing a different layer of user behavior and answering a different question you might be asking.
Types of behavioral analytics
There isn’t just one type of behavioral analytics. Different approaches focus on different aspects of user behavior that each can have its own impact on your conversions.core
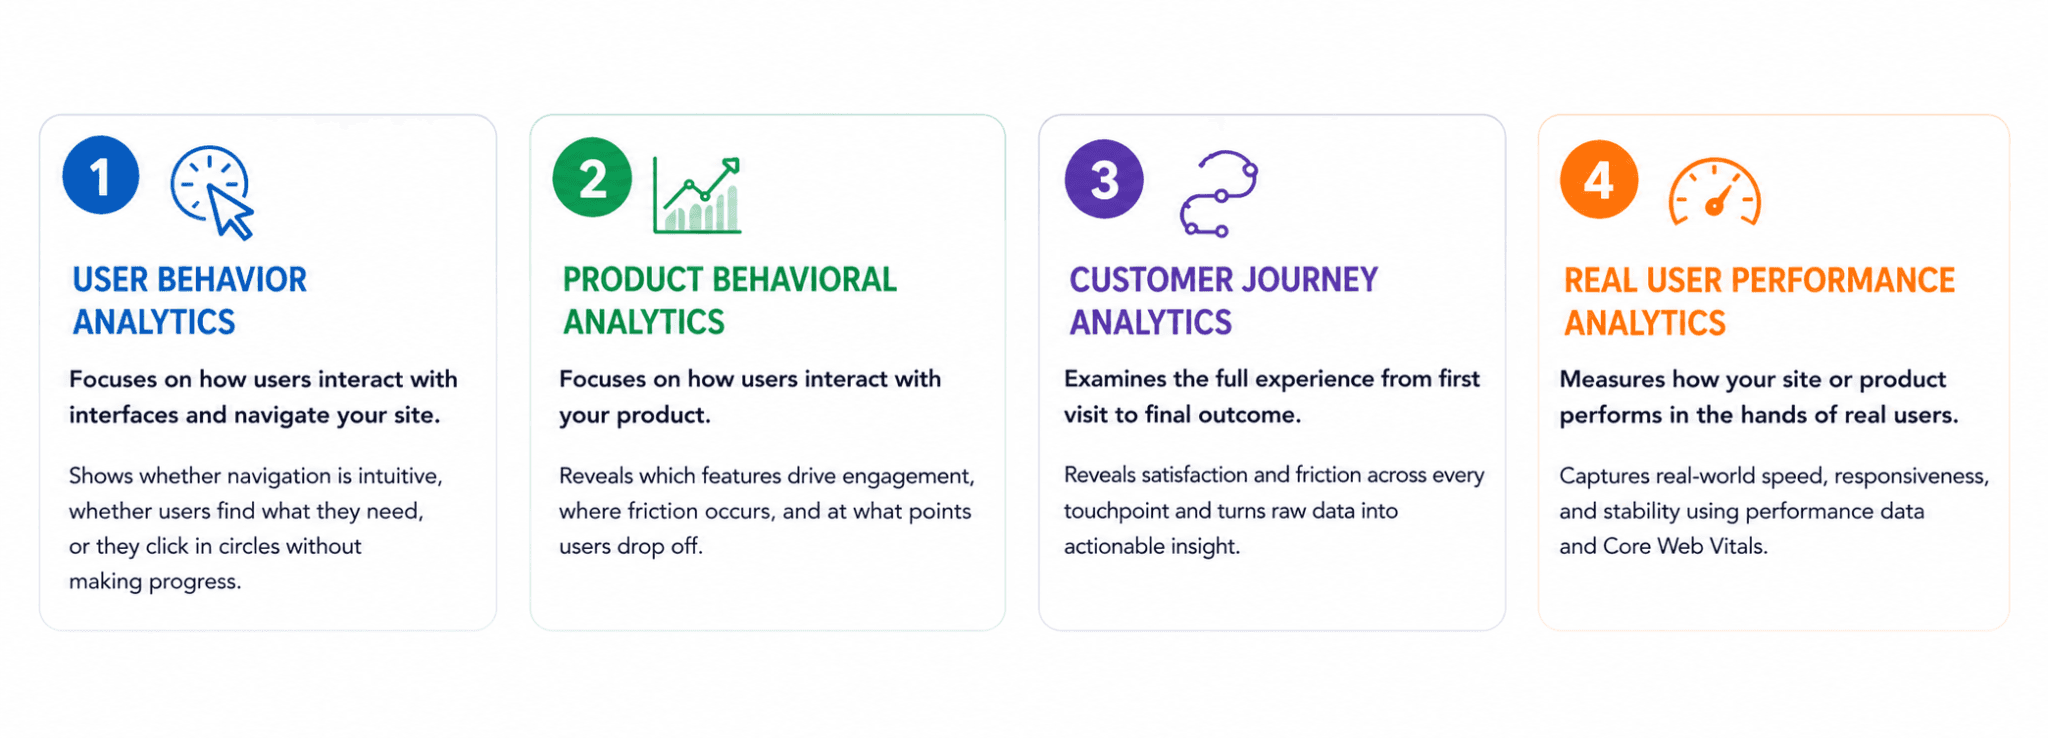
User behavior analytics
This type focuses on how users interact with interfaces - not just aesthetically, but functionally. It shows whether navigation is intuitive, whether users find what they need, or they click in circles without making progress.
Common tools include:
Heatmaps (click, scroll, hover maps)
Session replay tools
Click tracking
Heatmaps are particularly revealing because they aggregate thousands of user sessions into a single visual, making it immediately obvious that most users never see your CTA because it sits below the scroll threshold for 74% of visitors on mobile. That's not a design opinion, but a concrete fact that you can act on immediately.
These tools help visualize user actions and understand how they interact with pages, which is foundational for UX improvements.
Product behavioral analytics
For SaaS companies, the product is where value is ultimately delivered and where conversions are won or lost. Even the most effective marketing and seamless website experience won’t matter if users struggle to understand or use the product itself.
Product behavioral analytics focuses on how users interact with your product, using methods such as:
Event tracking
Feature usage analytics
Retention analysis
These insights reveal which features drive engagement, where users encounter friction, and at what points they drop off. Instead of relying on assumptions, product teams can prioritize improvements that directly impact activation, adoption, and retention.
Without this visibility, efforts often stay confined to optimizing the website experience, bringing in more traffic and extending sessions, but failing to influence actual product usage or revenue.
A clear understanding of in-product behavior ensures that user interest translates into meaningful engagement, and ultimately, paying customers.
Customer journey analytics
Customer journey analytics examines the full user experience - from the moment someone lands on your site to the point they exit, whether that ends in a purchase or a bounce. Core capabilities include:
Funnel analysis
User journey mapping
Path analysis
These tools reveal both satisfaction and friction across the experience, turning raw behavioral data into actionable insight. With a clear view of how visitors move through your site, you can identify:
How users engage across multiple steps
Where conversions happen and where drop-offs occur
How different touchpoints connect and influence decisions
The result is a comprehensive understanding of customer behavior, highlighting friction points and opportunities for optimization. By refining these moments, you can create journeys that are longer, smoother, and more effective at driving conversions.
Real user performance analytics
Real user performance analytics measures how your site or product actually performs in the hands of users. It combines techniques such as Real User Monitoring (RUM), performance tracking, and Core Web Vitals analysis to capture real-world speed, responsiveness, and stability.
Performance isn’t separate from behavior, it directly shapes it. Slow load times, laggy interactions, or visual instability increase drop-offs, reduce engagement, and limit conversions. Even minor technical issues can undermine an otherwise well-designed experience.
By connecting performance data with behavioral analytics, teams can pinpoint where technical problems translate into user frustration. This makes it possible to prioritize fixes that have a measurable impact on engagement and revenue, rather than optimizing in isolation.
Each of these analytics approaches generates valuable data but without the right tools to capture, interpret, and act on it - that data remains unused. Choosing a platform that aligns with your goals is what turns insight into impact.
Which tools are right for your team?
Behavioral analytics tools vary widely in what they measure. The key is not choosing the tool with the most features, but selecting behavioral analytics software that aligns with the specific user behaviors you want to understand. Whether you're analyzing product usage, optimizing UX, or improving conversion funnels, the right combination of tools for analyzing user behavior will determine how actionable your insights actually are.
Uxify
Uxify starts where most behavioral analytics platforms stop. It captures the same foundational signals (real user sessions, Core Web Vitals, INP, scroll and interaction data), but rather than returning those insights as a report, it ties them to business outcomes and acts on them if optimization is needed.
Uxify's AI agents use behavioral data as a continuous input: Navigation AI reads how users navigate and preloads the pages they're most likely to visit next; INProve identifies interaction latency and resolves it without a developer deploy. The result is a behavioral analytics workflow where the analysis-to-fix cycle is measured in minutes rather than weeks. For ecommerce and SaaS teams running high-traffic experiences, that speed compounds. Еvery behavioral signal becomes an optimization, and every optimization feeds the next round of analysis.

Amplitude
Amplitude is built for product teams that need to understand behavior at depth, i.e. how users move through a product over time, not just on a single session. Its strength is event-based analytics: teams define the actions that matter, track them across user cohorts, and analyze retention, drop-off, and feature adoption with granular control.
Where Amplitude’s strength really shows is in the analysis layer. Its funnel and path analysis tools make it possible to segment behavioral patterns by acquisition channel, device type, or user lifecycle stage, turning a flat drop-off rate into a specific, fixable problem. It's less useful for surface-level UX friction (heatmaps aren't its focus) and more useful once you're asking serious questions about product engagement.
Hotjar
Hotjar is designed for qualitative insight via core tools like heatmaps, session recordings, and on-site feedback. It provides a visual layer on top of user behavior, making it easier to interpret how people experience a page.
This makes Hotjar particularly useful for UX research and early-stage optimization. Instead of relying solely on numbers, teams can observe real interactions: where users click, how far they scroll, and where confusion arises. While it doesn’t offer the same depth in event-based analytics as product-focused tools, it excels at quickly uncovering usability issues and validating design decisions.
Mixpanel
Mixpanel occupies similar territory to Amplitude but with a sharper focus on real-time event analytics and a slightly lower barrier to entry for marketing and growth teams. It allows teams to measure how users move through key flows, identify drop-off points, and analyze the impact of specific actions on conversion.
Mixpanel also handles A/B experiment analysis well, making it a practical choice for teams running continuous optimization programs. Like Amplitude, it's strongest once you've moved past basic UX observation and into questions about conversion path efficiency, feature adoption, and user cohort behavior over time.
Each of these tools supports different aspects of behavioral analytics, from session replay to advanced event tracking. Just make sure you are using the right tool to measure and analyze exactly those facets that you are interested in.
Once you've figured out the means, the next question is what metrics to actually measure.
What are some key behavioral analytics metrics?
Choosing the right tools gets you access to data. Choosing the right metrics is what determines whether that data actually changes anything. Session recordings, click maps, funnel reports, performance traces - these can just be noise unless you know which numbers connect directly to user behavior and business outcomes.
Most teams track too much and act on too little. The categories below cut through that by answering a different question about your users. Together, they tell you exactly where to focus.
Engagement metrics
These metrics measure how visitors interact with your website, and they are a key factor that determines how many of them will actually proceed to purchase.
Engagement metrics provide you with the following data:
Session duration
Pages per session
Interaction rate
These metrics show how deeply users engage. Knowing the depth of these actions will allow you to focus on meaningful improvements instead of wasting your time on fixing things that aren’t broken.
Behavior metrics
Rather than counting individual actions, behavior metrics focus on the patterns of user behavior directly: click patterns, navigation paths, feature usage, and repeated user actions.
These metrics help you identify patterns in how users act. A user who opens your pricing page, returns to the homepage, visits the pricing page again, and then bounces signals one thing - they didn't find the answer they needed. Individual clicks look like normal behavior, but the pattern reveals a problem with how your pricing page communicates value.
Conversion metrics
All behavioral analysis ultimately connects to conversion. Conversion metrics measure the outcomes directly: conversion rate, funnel completion rate, and drop-off rate. They show how effectively your product turns visitors into customers.
These are the metrics that translate behavioral insights into business results. The moment you connect "users hesitate at step 3" to "funnel completion rate increases by 18% when step 3 is simplified" is the moment behavioral analytics stops being an analytics function and becomes a revenue function.
Experience metrics
Performance is behavior. A page that takes three seconds to load, an interaction that freezes mid-tap, a layout that shifts as a user reaches for a button - these aren't technical issues that exist separately from the user experience. They are the user experience. Experience metrics capture exactly that:
Page load time
Core Web Vitals
Error rates
When these numbers degrade, behavioral metrics follow. When the experience fails, you see it in the drop-off rates that start to climb, the engagement depth that’s rapidly shrinking, and the conversion rates that fall. That's why experience metrics belong in the same conversation as engagement, behavior, and conversion data, not in a separate performance dashboard nobody checks.
How to apply behavioral analytics in real life
Up until this point, everything we talked about is strictly theoretical - what are behavioral analytics, why are they important, what metrics to track. But to come full circle, let’s look at real-life scenarios that can best depict how behavioral analytics can help you improve your digital experience.
Improving user onboarding
A SaaS company notices that new users drop off during onboarding. Using behavioral analytics, they discover that users skip key steps, instructions are unclear, and the process is too long. By simplifying onboarding, a company can increase activation rates significantly.
Identifying UX friction
Session replays reveal users repeatedly clicking a non-clickable element. This indicates confusion. Fixing this small issue improves usability and reduces frustration. This is a classic example of using behavioral analytics to improve UX.
Optimizing conversion funnels
An ecommerce business analyzes its checkout funnel and finds a major drop-off at the payment page. Further analysis shows unexpected costs and slow load times. By addressing these issues, conversions increase.
Improving feature adoption
Product analytics shows that a new feature has low usage. By analyzing user data, the team learns that users don’t notice the feature since it is buried in navigation. After redesigning visibility, adoption increases.
Case study: Uxify Navigation AI and INProve in action
To demonstrate how behavioral analytics and AI-driven optimization work together in practice, Uxify analyzed over 626,000 sessions across ecommerce brands over three months. Navigation AI, which predicts where users will click next and preloads those pages before they get there, and INProve, which identifies and resolves interaction latency in real time, are the two agents that make up Uxify's CRO optimization layer. Together they only activate on multi-page sessions, roughly 10% of traffic, but the effect cascaded across all visitors:
Conversion rate: Every brand in the study saw an increase, with a median relative lift of +34%
Add-to-cart rate: All 19 brands improved, with a median relative lift of +28% and some brands seeing increases of +59% or more.
Average order value: AOV rose for 94% of stores, with a median gain of +3.5% and a mean of +3.7%.
Site speed and engagement: LCP improved across every site tested, with a median of 4.3% faster and up to 32% faster on top-performing stores. Pageviews per session increased by 26% on average as shoppers explored more products.
Results were consistent across fashion, home goods, automotive, baby products, and other verticals, demonstrating that behavioral data, coupled with agents that act on it automatically, can lift revenue metrics across the board
When does Behavioral Analytics drive real revenue?
Behavioral analytics isn't a reporting discipline. It's a decision-making system. Every signal your users generate, where they click, where they hesitate, where they give up, is telling you something your traffic dashboards can't. The teams that act on that data consistently, across UX, performance, and conversion, are the ones that improve at scale rather than chasing one-off fixes.
The framework is straightforward: collect the right behavioral data, process it into patterns, and connect those patterns to the metrics that actually move your business. Engagement, behavior, conversion, and experience - each captures a different layer of how users interact with your product, and together they give you a complete picture of where friction lives and what it's costing you.
That picture is never finished. Every fix surfaces a new pattern, every improvement shifts how users interact, and every shift generates new data to act on. The question is how quickly this process moves from signal to action and whether your optimization process is fast enough to keep up with how your users actually behave.
Frequently asked questions
What data is used in behavioral analytics?
Behavioral analytics uses behavioral data collected from user interactions, including clicks, scrolls, navigation paths, and session recordings. This user data provides insight into how users tend to interact with digital products.
What tools are used for behavioral analytics?
Popular tools include Uxify, Amplitude, Hotjar, and Mixpanel. These tools help collect and analyze behavioral analytics data, from session replays to event tracking.
How does behavioral analytics improve user experience?
By analyzing user behavior, teams can identify friction points, optimize navigation, and improve usability. It leads to a better overall experience and higher engagement.
How does real user monitoring support behavioral analytics?
Real User Monitoring (RUM) adds performance context to behavioral analytics. It helps you understand how performance impacts behavior, why users abandon pages, and how speed affects conversions. Combining performance data with behavioral analytics gives a complete picture of the user experience.

" height="200.00000219726564px" id="j9Mmwfnw8" transform="translate(143.5 0)" width="479.5329973144531px"/><path d="M 0 15.944 C 0 7.139 7.154 0 15.98 0 C 24.804 0 31.959 7.138 31.959 15.943 L 31.959 59.637 C 31.959 68.442 39.113 75.58 47.938 75.58 C 56.763 75.58 63.917 68.442 63.917 59.637 L 63.917 15.944 C 63.917 7.139 71.071 0.001 79.897 0.001 C 88.721 0.001 95.875 7.139 95.875 15.944 L 95.875 56.095 C 95.875 82.51 74.413 103.923 47.938 103.923 C 21.462 103.923 0 82.51 0 56.095 Z" fill="rgb(59, 63, 91)" height="103.923px" id="KJCDMITFE" transform="translate(0 53)" width="95.875px"/><path d="M 0 15.943 C 0 7.138 7.154 0 15.979 0 C 24.804 0 31.958 7.138 31.958 15.943 C 31.958 24.748 24.804 31.886 15.979 31.886 C 7.154 31.886 0 24.748 0 15.943 Z" fill="rgb(252, 200, 0)" height="31.885999999999996px" id="q2K9EYOvZ" transform="translate(0 53)" width="31.95799999999963px"/><path d="M 0 15.943 C 0 7.138 7.154 0 15.979 0 C 24.804 0 31.958 7.138 31.958 15.943 C 31.958 24.748 24.804 31.886 15.979 31.886 C 7.154 31.886 0 24.748 0 15.943 Z" fill="rgb(63, 184, 126)" height="31.885999999999996px" id="bBya7XCj7" transform="translate(64 53)" width="31.95799999999963px"/><path d="M 0 14.171 C 0 6.344 6.359 0 14.204 0 C 22.048 0 28.407 6.344 28.407 14.171 C 28.407 21.997 22.048 28.342 14.204 28.342 C 6.359 28.342 0 21.997 0 14.171 Z" fill="rgb(229, 0, 106)" height="28.341999999999985px" id="WNzwBFOi7" transform="translate(34.5 128.5)" width="28.407000000000153px"/></g></svg>)