
Key takeaways:
- Real User Monitoring provides the only source of truth regarding how users experience your website's speed and stability.
- Combining RUM with synthetic monitoring gives you a complete view of performance metrics, ensuring you catch outages and optimization opportunities before you push changes live.
- Modern RUM tools allow you to correlate site speed directly with revenue drops, helping you prioritize fixes.
You can’t fix what you don’t measure, and guessing how your site performs for actual visitors is a losing strategy. Real User Monitoring eliminates guesswork by capturing data directly from users navigating your site in real time. It’s the difference between assuming you have a clear and optimized user journey and knowing exactly where people face friction.
RUM provides the performance data you need to boost revenue and retention. By tracking every user’s journey, you gain visibility into how speed impacts the bottom line.
What is Real User Monitoring (RUM)?
Real User Monitoring (RUM) is a passive performance monitoring method that collects data directly from the browsers and devices of the people actually using your website. Instead of simulating visits in a controlled environment, RUM sits quietly in the background and records real visitor interaction data from their devices, their networks, and their connection speeds.
Every page load, navigation, and interaction becomes a data point. RUM tools typically capture:
- Core Web Vitals : LCP (Largest Contentful Paint), INP (Interaction to Next Paint), and CLS (Cumulative Layout Shift), plus supporting metrics like TTFB and FCP.
- Page performance timings : DNS lookup, TCP connect, TLS negotiation, and the various browser rendering milestones exposed by the Navigation Timing and Paint Timing APIs.
- User context : device type, browser, operating system, geographic location, and connection type.
- Behavioral signals : clicks, scroll depth, rage clicks, dead clicks, and U-turns back out of a page.
- Errors : JavaScript exceptions and failed network requests that users actually hit.
Most RUM tools do not measure things like “feature usage” in the product analytics sense, and they generally don’t capture server-side events, database queries, or backend traces. That’s the job of APM (application performance monitoring) tools like New Relic or Datadog, which sometimes bundle RUM alongside backend tracing but are architecturally different layers. RUM is strictly the browser-side truth.
Where RUM gets its edge is in capturing the messiness of the real world that synthetic tests can’t replicate: a user in Bulgaria on a mid-tier Android phone with a flaky 4G connection, a Shopify checkout opened in Safari with three ad blockers installed, a desktop user on a corporate VPN routing through three continents. All of these experiences show up in your data, weighted by how often they actually happen.
For an ecommerce store, that translates into concrete answers: Why does mobile convert 40% worse than desktop on this landing page? Is it the LCP, the INP on the “Add to cart” button, or a layout shift pushing the CTA below the fold just as the user goes to tap it? Only RUM can tell you.
How Real User Monitoring Works
The mechanism is straightforward. You add a small JavaScript snippet to the <head> of your site, and from that point on, every visitor’s browser automatically reports back on what they experienced. Page load times, rendering milestones, interaction delays, layout shifts, errors, and user actions like rage clicks all flow into your RUM tool as sessions happen.
The script is lightweight and loads asynchronously, so it doesn’t slow the page down for users. Under the hood, it hooks into a set of standard browser APIs (Navigation Timing, Paint Timing, Performance Observer, Layout Instability) that modern browsers already expose for exactly this purpose. You’re not instrumenting anything custom; you’re reading numbers the browser is already measuring and shipping them somewhere you can actually work with them.
What makes RUM different from a synthetic test is that the measurement happens inside each user’s own browser, on their real device, over their real network. A Lighthouse run tells you how your page performs on a simulated mid-tier Android with a throttled connection in a Google datacenter.
RUM tells you how it performs for a real customer on an iPhone 12 on Verizon LTE in a suburb of Dallas, with two ad blockers installed and a CDN edge node that’s mysteriously slow today. Both are useful, but only one of them is what’s actually costing you conversions.
That real-world variance is the whole point. Your RUM data reflects every condition your traffic actually encounters: device mix, geographic spread, connection quality, third-party script weirdness, browser-specific quirks. All weighted by how frequently each of those scenarios happens, which means the numbers you’re looking at are already a reasonable proxy for the numbers your revenue depends on.
Key Benefits of Real User Monitoring
Deploying RUM transforms raw numbers into actionable business intelligence by improving page speed, user experience, incident response, and data-driven optimization.
Improved Pagespeed
By identifying exactly which assets are slowing down specific pages for users, you can target your performance optimization efforts effectively. Real User Monitoring pinpoints the heavy images or third-party scripts dragging down load times.
Real-Time UX Insights
RUM tools show you user behavior trends as they unfold, alerting you if a specific region or device type is struggling. It allows you to visualize the user journey and see where drop-offs happen. Sometimes the data shows you UX errors before support tickets even start coming in.
Improved Incident Response
When things break, RUM helps you distinguish between a global outage and a localized ISP issue. You can correlate error rates with specific user interactions to find the root cause faster. It saves your engineering team from chasing ghosts.
Data-Driven Optimization
Stop arguing over which feature to fix first and let the performance data dictate your roadmap. Real User Monitoring proves which performance improvements will actually move the needle on conversions.
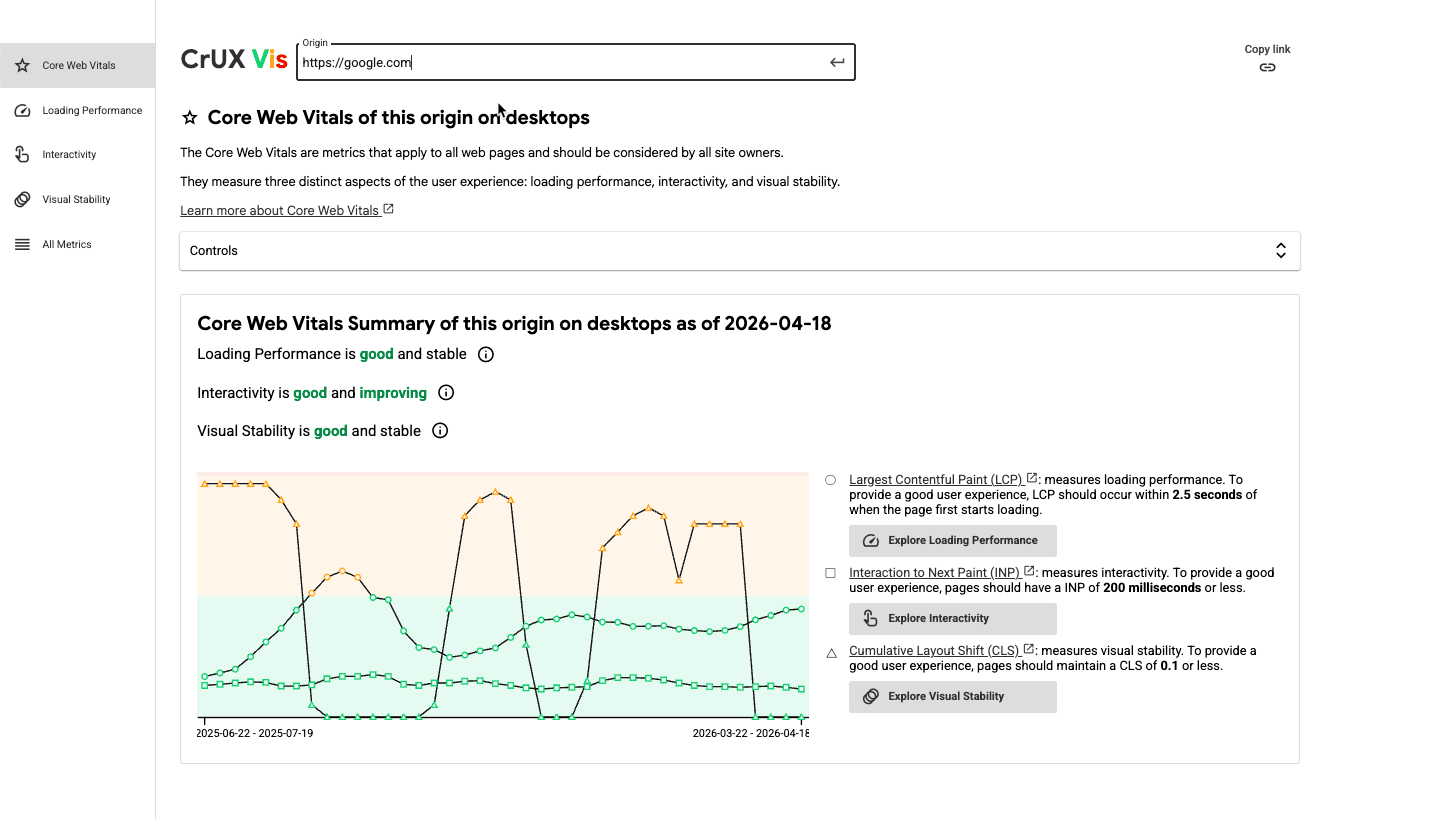
The Chrome User Experience Report (CrUX): the biggest RUM dataset in the world
No discussion of RUM is complete without CrUX, Google’s public dataset and the backbone of how Google itself measures user experience across the web. CrUX is a real user dataset, not a synthetic one, and it’s the source of the “field data” you see in PageSpeed Insights, Search Console’s Core Web Vitals report, and the CrUX API and BigQuery exports.
A few things worth understanding about how CrUX actually works, because they matter a lot when you’re comparing numbers:
- It only collects data from Chrome users , and not all of them. A user’s session is only included if they use desktop Chrome or Chrome on Android, are signed into a Google account with browsing history sync enabled (without a sync passphrase), and have usage statistics reporting turned on. Chrome on iOS is excluded entirely, as are Safari, Firefox, Edge, and every other Chromium-based browser.
- All CrUX values are a 28-day rolling aggregate reported at the 75th percentile . When you look at your LCP in PageSpeed Insights, you’re looking at the experience of the worst 25% of users over the last 28 days, not a real-time snapshot.
- Data is delayed by about two days , which means that after you ship a fix, it takes roughly 3 days for any movement to start showing up in CrUX and a full 30 days for the change to be fully reflected.
- A page or origin needs enough traffic to qualify . If your site doesn’t meet the threshold (Google doesn’t publish the exact number, but it’s generally in the low thousands of page views per month), CrUX simply has no data on you.
This is why first-party RUM and CrUX are complementary, not redundant. CrUX tells you how Google sees your site, which matters because CrUX data feeds Google’s page experience ranking signals. Your own RUM tool tells you what’s actually happening across all browsers, at session-level detail, in near real time.
Best Real User Monitoring Tools in 2026
Choosing the right tool is critical for gathering accurate insights. Here are the top RUM tools to consider.
Google PageSpeed Insights + the CrUX Vis tool
If you’ve never measured your site’s real user performance before, start here. Both tools are free, they pull from the same CrUX dataset Google uses for its own ranking signals, and they take about 10 seconds to run.
PageSpeed Insights gives you your Core Web Vitals field data alongside Lighthouse lab data for any URL or origin, yours or a competitor’s. The CrUX Vis tool plots 40 weeks of historical CrUX data so you can see whether you’re trending up or down over time, not just where you sit today.
Where these tools shine is in quick diagnostics and competitive checks. The limitations are the same ones covered above in the CrUX section, which makes both tools a solid starting point, but they fall short for teams that need deeper visibility to actually move the needle.
Uxify
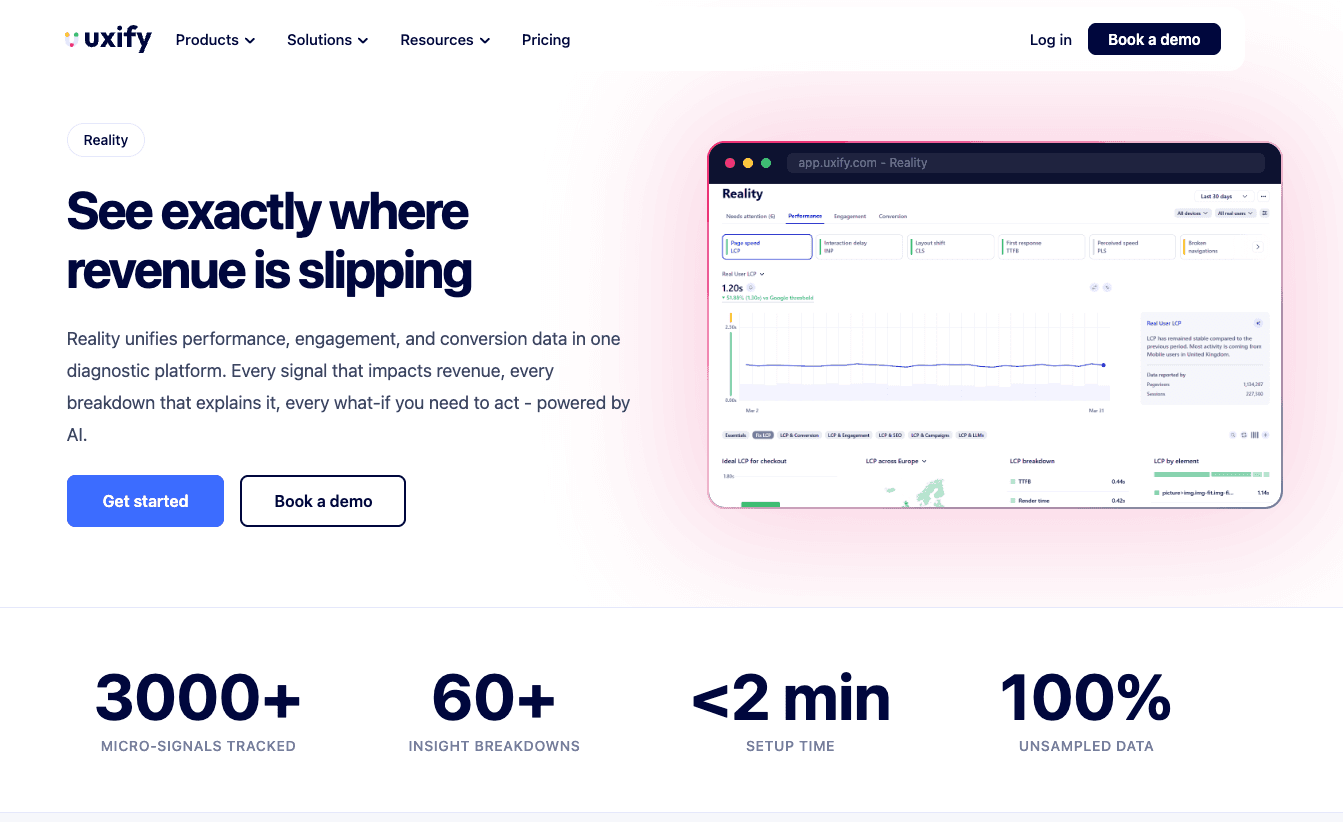
Uxify is built to solve the exact gaps CrUX leaves open. It’s a full digital experience platform, not just one tool:
- Reality , our RUM and behavior analytics suite. Tracks Core Web Vitals (LCP, INP, CLS) plus Perceived Load Speed (PLS), TTFB, FCP, and 3,000+ behavioral signals across every real user session, with 40+ metrics and 65+ breakdowns (device, campaign, traffic source, user type, and so on). Data is unsampled and updates in near real time, with no 28-day lag, no 75th-percentile-only view, and no Chrome-only blind spot. Every signal ties directly back to conversion and revenue, so you see which friction points actually cost you money. Works across Chrome, Safari, Firefox, and Edge, including iOS Safari.
- Benchmarking + Competitor Intelligence , which compares your speed, experience, and engagement metrics against similar sites in your industry and specific competitors you choose, so you know where you stand and where the gap is worth closing.
- Navigation AI , which predicts where users are likely to click next and prerenders those pages using the Speculation Rules API, so navigation feels instant.
- INProve , which automatically resolves INP bottlenecks across your site, with no dev work.
- Ask Uxi , an AI agent that answers plain-English questions about your data (“why is my LCP failing on mobile in Germany?”) and returns charts, root causes, and prioritized fixes.

New Relic
New Relic offers a comprehensive suite for observing your entire stack, including detailed Real User Monitoring capabilities. It excels at connecting backend traces with frontend user interactions. Engineers love it for the deep technical data the solution provides.
Dynatrace
Dynatrace provides AI-powered answers rather than just charts, which makes it a heavy hitter for enterprise RUM. It automatically detects anomalies in load times and user journey flows. While powerful, the price tag is also steep.
Pingdom
Pingdom is well-known for synthetic testing, but its Real User Monitoring offering is also solid for simple, straightforward insights. It breaks down performance metrics by geography and device clearly. It’s great for teams that just want the basics.
Middleware.io
Middleware provides full-stack observability that correlates infrastructure health with RUM data. It helps you see how server-side issues impact users on the frontend. It connects the dots remarkably well.
RUM Use Cases Across Industries
Ecommerce
For online stores on platforms like Shopify , every millisecond of latency can correlate directly to lost sales. RUM tracks the user journey from landing page to checkout, highlighting where friction kills conversion.
SaaS and Web Apps
SaaS platforms use Real User Monitoring to ensure features function smoothly within the application dashboard. It helps product teams understand how users interact with new updates or complex tools.
Media and Publishing
High traffic volume requires strong performance monitoring to handle spikes without crashing the user experience. RUM helps publishers balance ad revenue scripts with Core Web Vitals compliance.
RUM Metrics That Matter
Core Web Vitals
Google’s Core Web Vitals (LCP, INP, CLS) are the gold standard for measuring UX. Real User Monitoring is the only way to accurately measure these metrics across your actual audience.
Page Load Times
Average load time is useful, but RUM lets you see the 95th percentile, representing the slowest load times your users actually experience.
As Google has shown , going from a 1-second load time to a 3-second load time raises the bounce rate by 32%. These trends continue as load times increase, so fixing the issues for the 95th percentile yields the biggest engagement improvements.
Engagement
RUM tools link speed to user engagement, showing how dwell time increases as latency drops. You can see distinct correlations between fast pages and more user interactions.
Error Rates and Bounce Rates
Tracking JavaScript errors and HTTP failures experienced by users is crucial for stability. High error rates detected by Real User Monitoring usually precede a spike in bounce rates.
Challenges and Limitations of RUM
While powerful, RUM is hardly a magic wand for every single scenario. It has challenges, as well as limitations.
Sampling vs Full Coverage
Some Real User Monitoring tools sample data to reduce costs, which can lead to missed edge cases. Full coverage ensures you capture every single one of the user interactions, but it requires more processing power.
If full data coverage isn’t a priority, you can rely on the public CrUX API by Google. However, if you want to understand all your users (including those on browsers beyond Chrome) you’ll need solutions like Uxify that collect real-time user data, adapt to it, and even resolve certain issues automatically.
Privacy and Data Regulation
Collecting user data requires strict adherence to GDPR and CCPA regulations. You must ensure your performance monitoring setup anonymizes PII (Personally Identifiable Information).
Dependency on JavaScript
Since RUM relies on scripts, it won’t work if the user’s browser blocks JavaScript or if the script fails to load. It can leave small blind spots in your user behavior data. It’s not too common, but sometimes it happens.
Additionally, modern ad blockers and privacy extensions can block RUM scripts entirely. This means your data may slightly skew toward less tech-savvy users who don’t use these extensions.
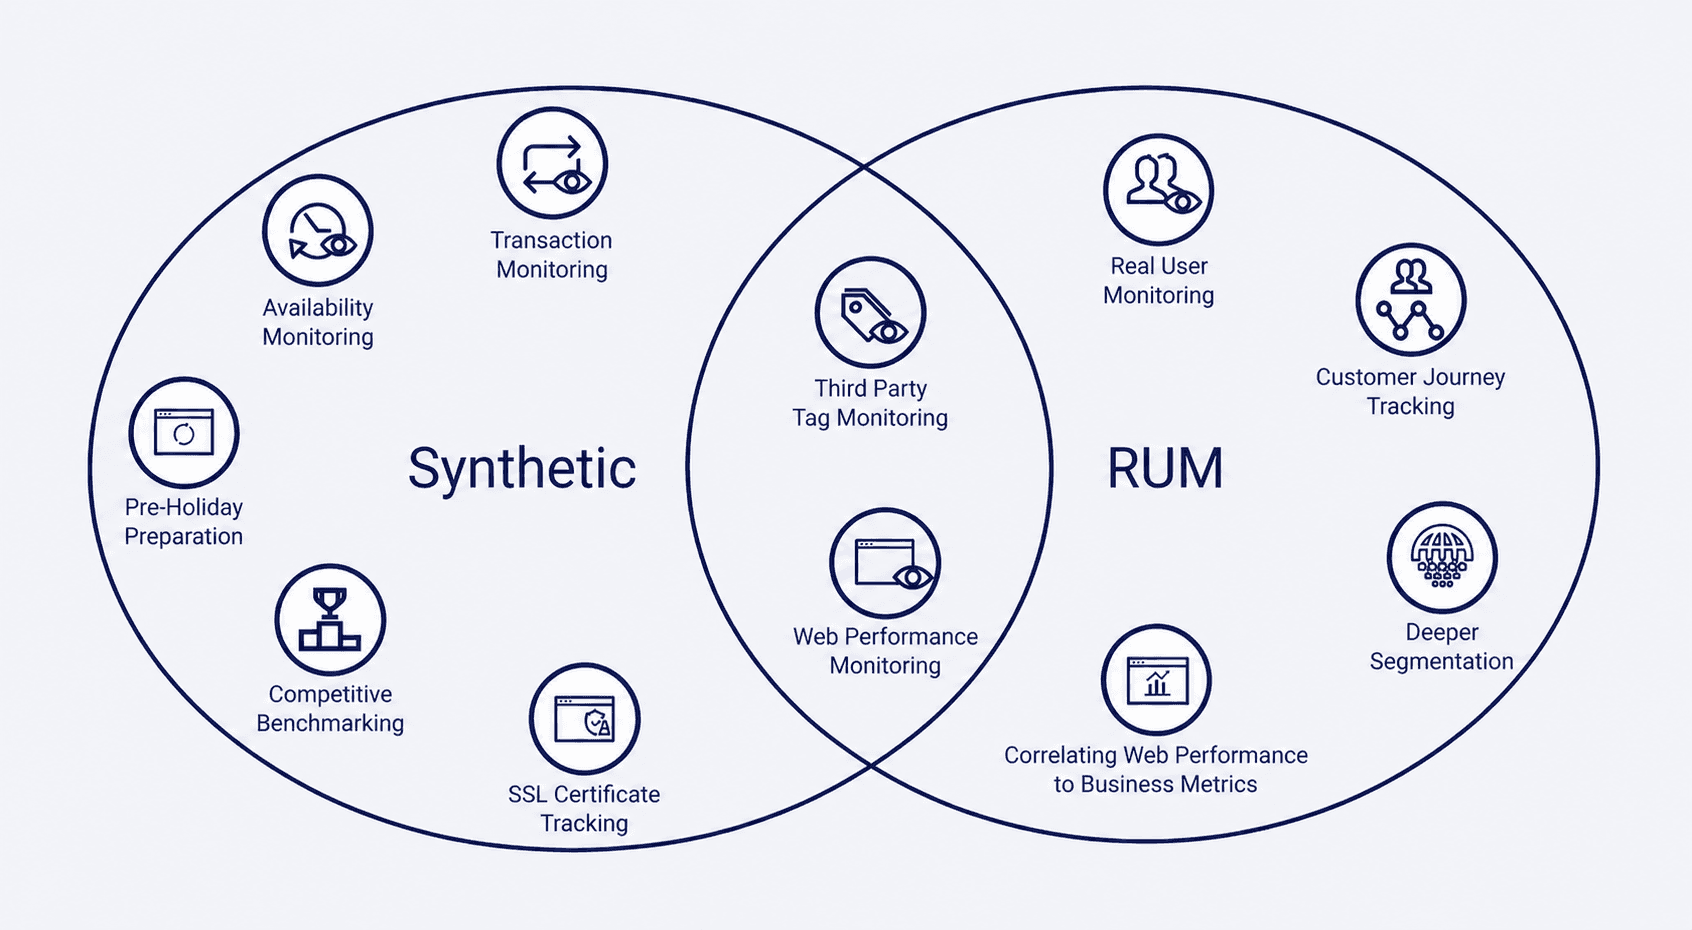
Real User Monitoring vs Synthetic Monitoring
Understanding the difference ensures you build a complete performance monitoring strategy efficiently.
Synthetic monitoring is consistent and great for benchmarking, but it never reflects the variability of users. Real User Monitoring captures the messy reality of the internet, but it can be harder to debug due to noise. In short, they’re complementary tools, not competitors.
You should use synthetic tools to alert you when the site is down, and use RUM to tell you if it’s slow. Combining them gives you a 360-degree view of performance improvements and stability. If you want to achieve the best results, you can’t rely on just one.
How to Implement RUM on Your Website
Getting RUM running on your site with Uxify takes minutes, not days:
- Sign up for Uxify at uxify.com . The Free plan includes 2,000 sessions/month, so you can start measuring before committing to anything.
- Install the JavaScript snippet. Copy the lightweight tracking script from your Uxify dashboard and paste it into the
<head>of your site. For platforms like Shopify , WordPress , WooCommerce , Webflow , and 50+ others, Uxify supports direct integrations that enhance data capture - automatically mapping user journeys, identifying funnel steps, connecting experience metrics to revenue, and enabling AI-based querying of your site data. - Start collecting data immediately. Core Web Vitals begin flowing within minutes, across every browser your users are actually on , including iOS Safari. This is a bigger deal than it sounds: most public datasets (CrUX, and any tool that relies on it) have a complete blind spot for Safari and iPhone users. Uxify measures INP on Safari natively .
- Turn on the optimizers when you’re ready. Navigation AI and INProve can be activated with one click and start improving LCP and INP automatically, without touching your codebase.
You don’t need to configure sampling, set up a data pipeline, or wait 28 days to see trends. The data is unsampled, real-time, and tied directly to revenue outcomes out of the box.

Frequently Asked Questions
Is RUM suitable for mobile apps?
Yes, most Real User Monitoring tools offer SDKs specifically for native mobile apps to track crashes and user interactions.
Does RUM affect website performance?
A well-optimized RUM script loads asynchronously, so it has a negligible impact on page load times for users.
What data does RUM collect?
It collects timing metrics, user behavior (clicks, scrolls), device info, and Core Web Vitals from the browser.
How to choose a Real User Monitoring tool?
Look for one that offers granular data on user sessions, integrates easily, and focuses on actionable metrics.
Why does my RUM tool sometimes show different numbers than Google’s CrUX?
Because they’re measuring different things. CrUX only tracks opted-in Chrome users (no Safari, Firefox, or iOS), reports a 28-day rolling aggregate at the 75th percentile, and comes with a 2-day lag. A first-party RUM tool measures every browser in near real time and shows you the full distribution. Neither is wrong, they just answer different questions: CrUX tells you how Google sees your site for ranking, RUM tells you what’s actually happening to your users right now.