Why standard analytics are not enough in 2026?
Having data and understanding it are two different things. The first is analytics. The second is intelligence, and most tools never get there.
Take a conversion rate that dipped on Tuesday. Analytics shows you the number dropped, but won’t show you the exact moment momentum broke or whether it’s linked to some other optimization you did earlier that week.
Tools like GA4 will show you the “what”. The “why” is left for you to piece together. In 2026, that’s no longer feasible. As AI becomes a commodity, the baseline expectation of any data tool isn't to hand you more numbers, it's to make sense of them and tell you what they mean for your bottom line.
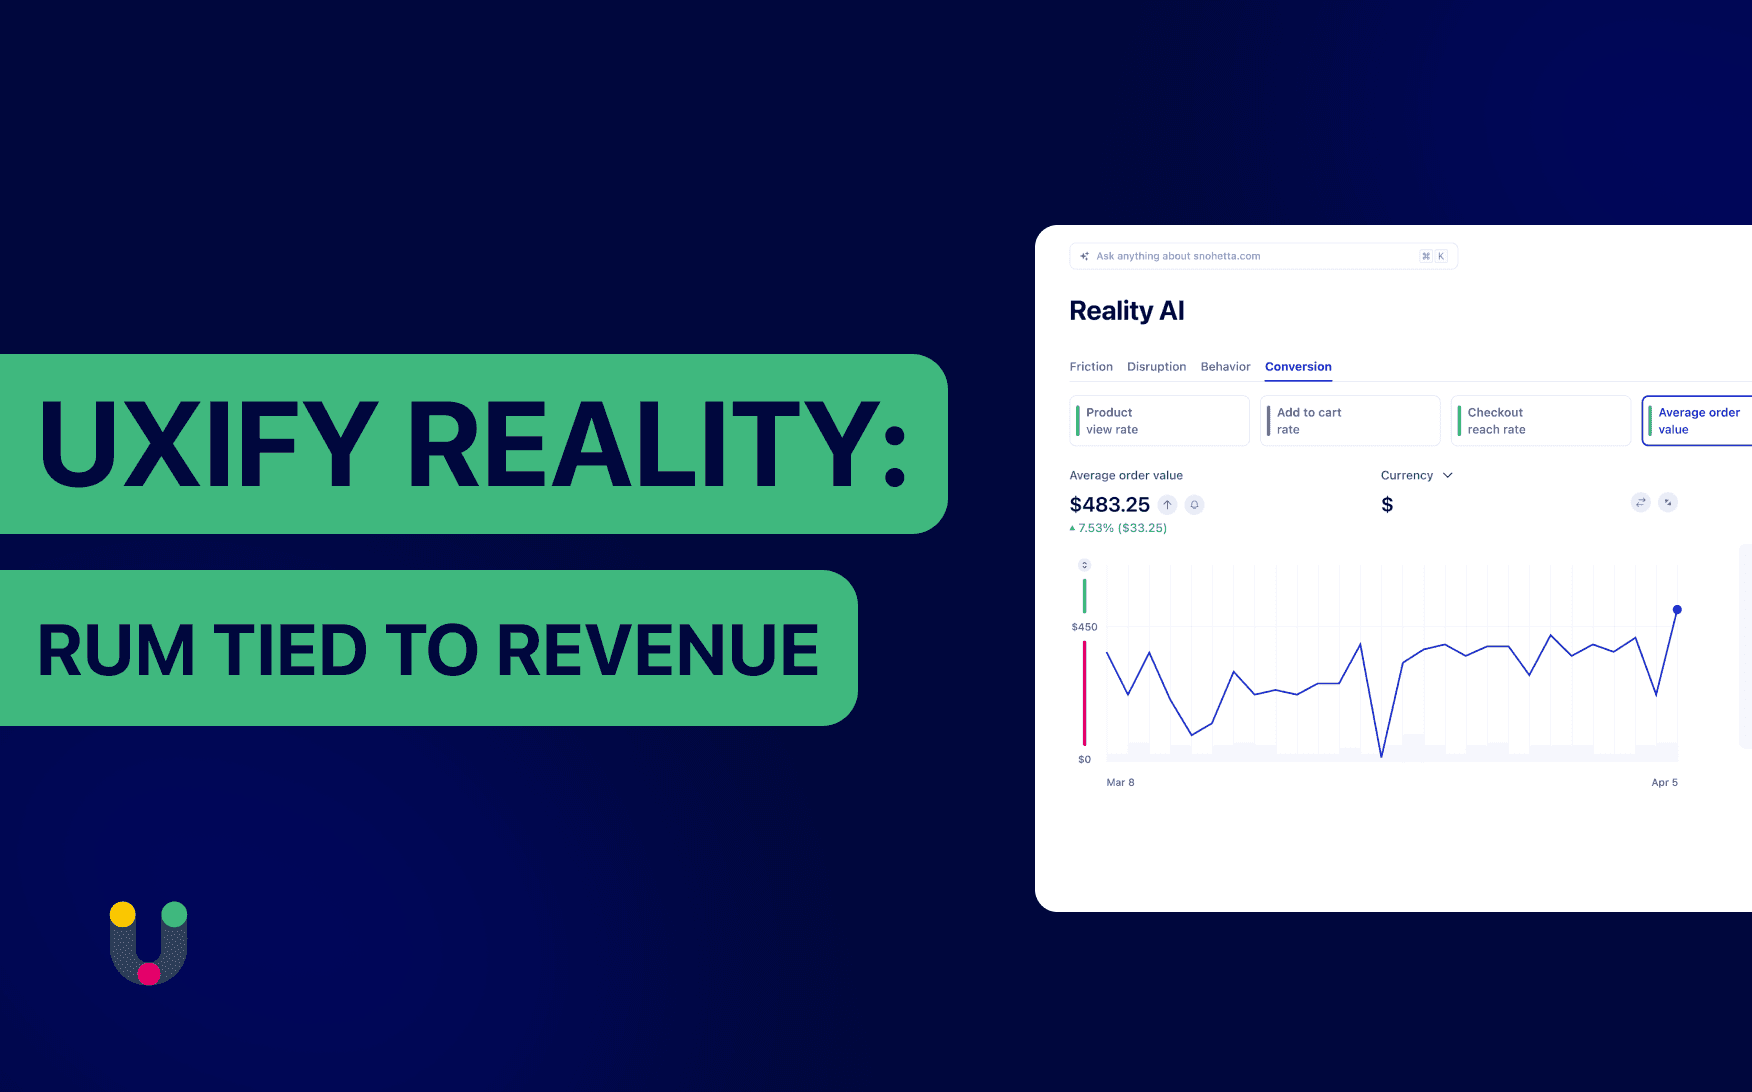
That's why we built Uxify Reality: the intelligence layer your business needs to address the needs of today’s world.
What is Uxify Reality?
Reality connects all those dots in one user intelligence layer. It captures performance, engagement, and conversion data from every real visit, ties it to revenue, and uses AI to surface what changed, where, and which segments moved it. Without forcing you to dig for answers or waste weeks on figuring out an issue and a fix.
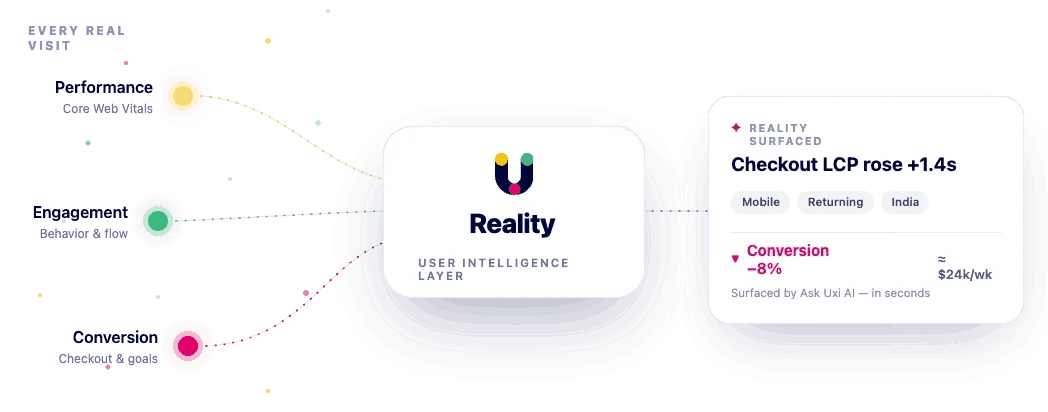
Reality is one diagnostic platform built around three pillars that work as one.
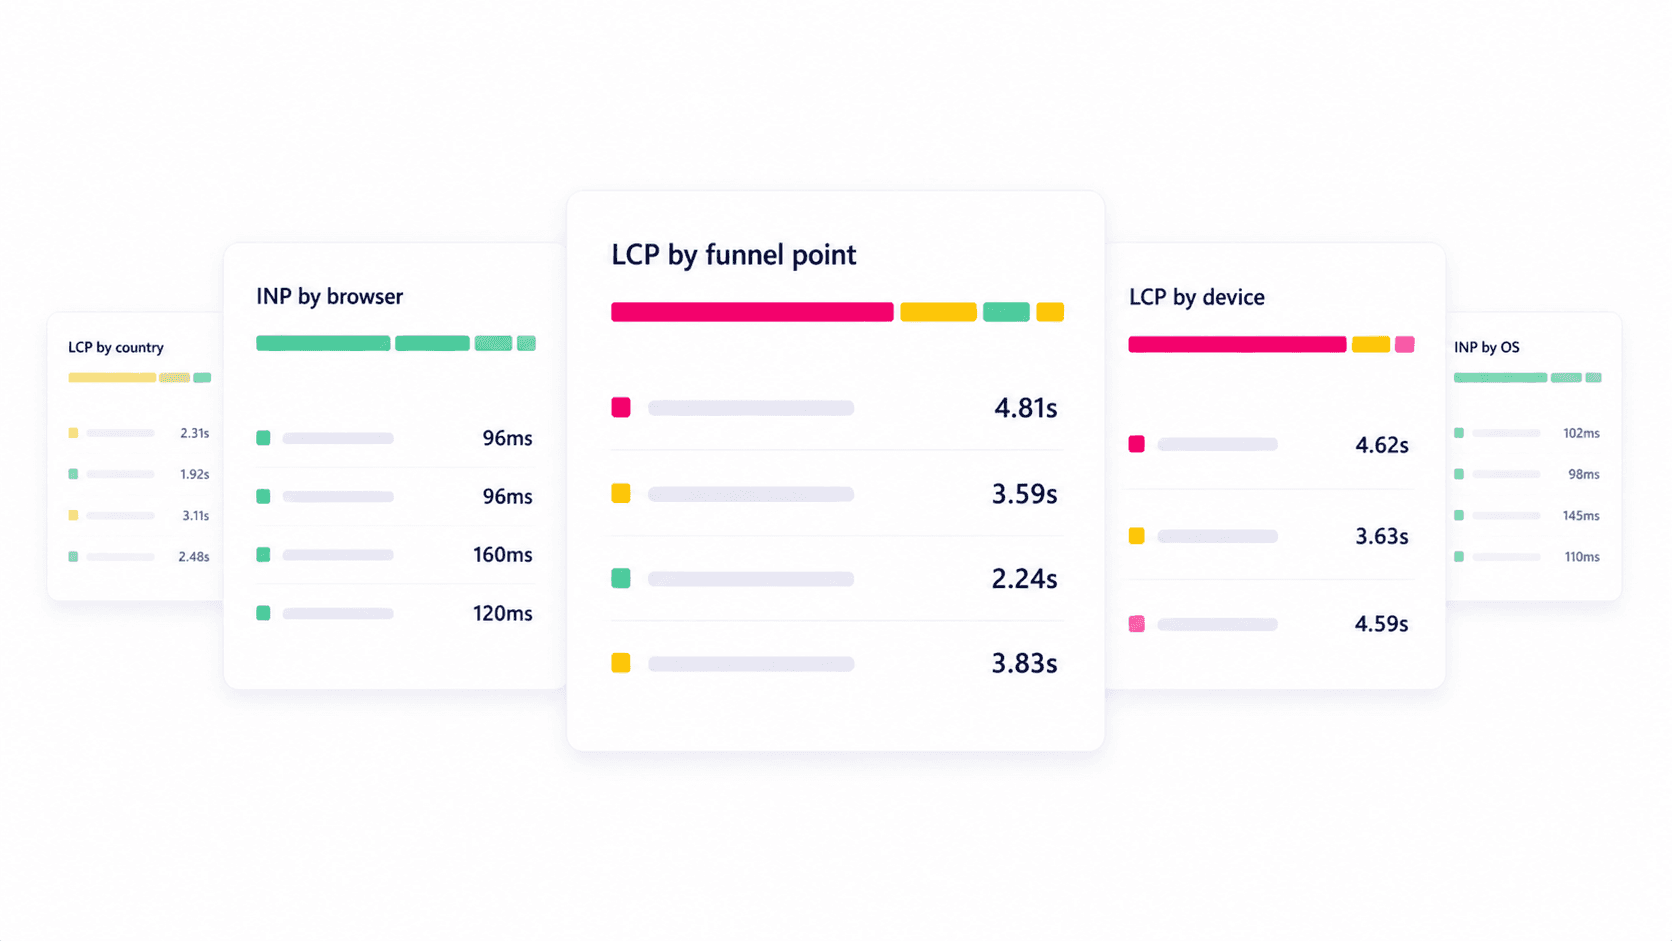
Performance covers the technical side of performance monitoring: every Core Web Vital (LCP, INP, CLS, TTFB) plus Uxify's own Perceived Load Speed metric, alongside broken, images, scripts, and styles.
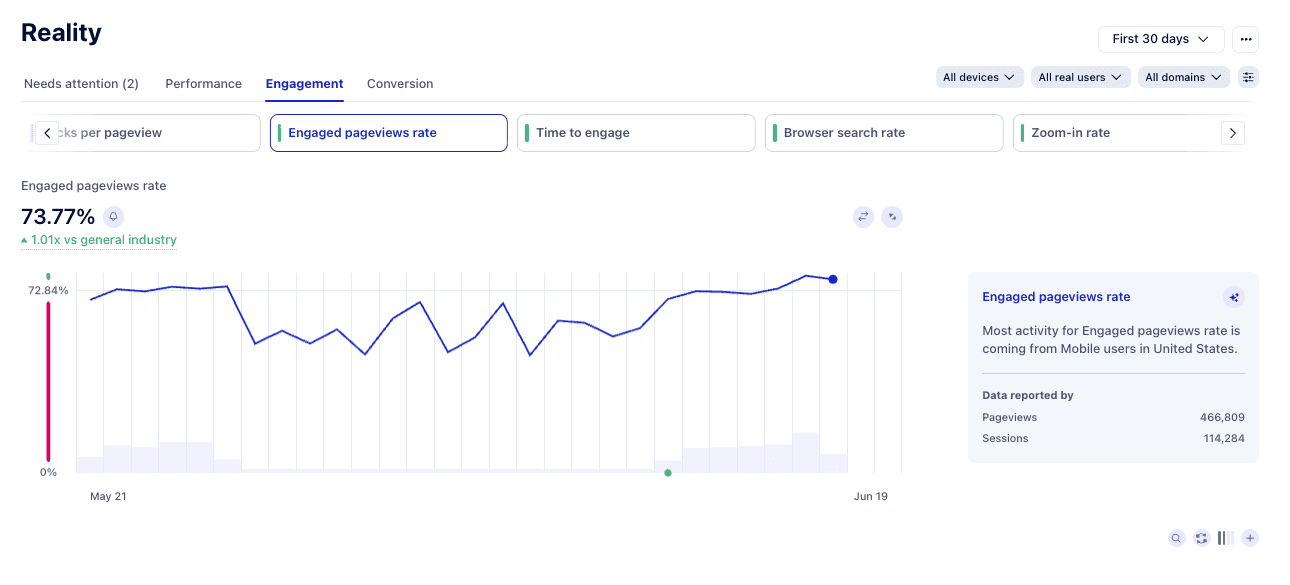
Engagement covers behavior: rage clicks, dead clicks, scroll depth, time-to-engage, form abandonment, and 20+ more behavioral signals.
Conversion covers business outcomes, and adapts to what you sell: checkout reach rate, AOV, cart abandonment, and time to checkout for ecommerce; trial-to-paid funnels for SaaS; engaged sessions and scroll depth for content sites.
Together, they answer the question every growth team is actually asking: what is my website doing to my revenue?
Performance: know everything about every website visit, spot the friction and see how it hurts your bottom line
Lab tools like Lighthouse run tests in controlled conditions. Useful for development, not so much for understanding what your users experience.
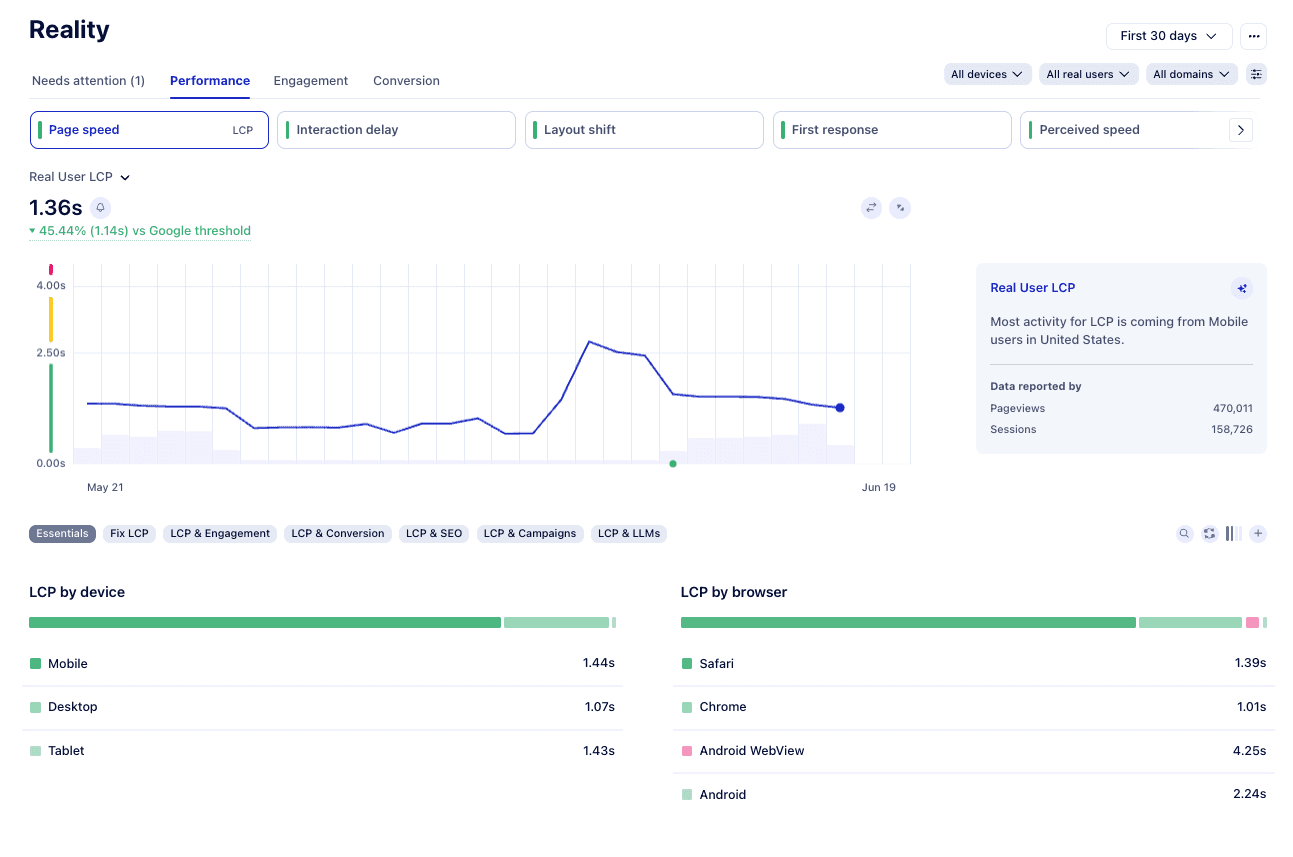
Reality's Performance pillar treats every visit as a live test. Every pageview generates real performance data (LCP, INP, CLS, TTFB, and Perceived Load Speed) across Chrome, Firefox, Safari, and every major browser. Thousands of data points per day, unsampled, with hour-level granularity in near real time.
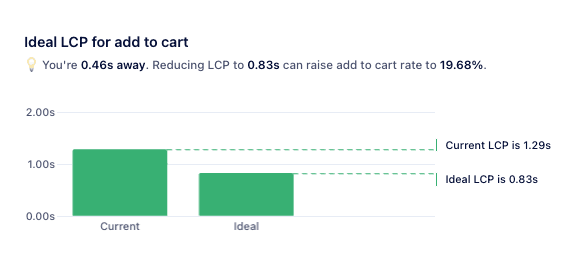
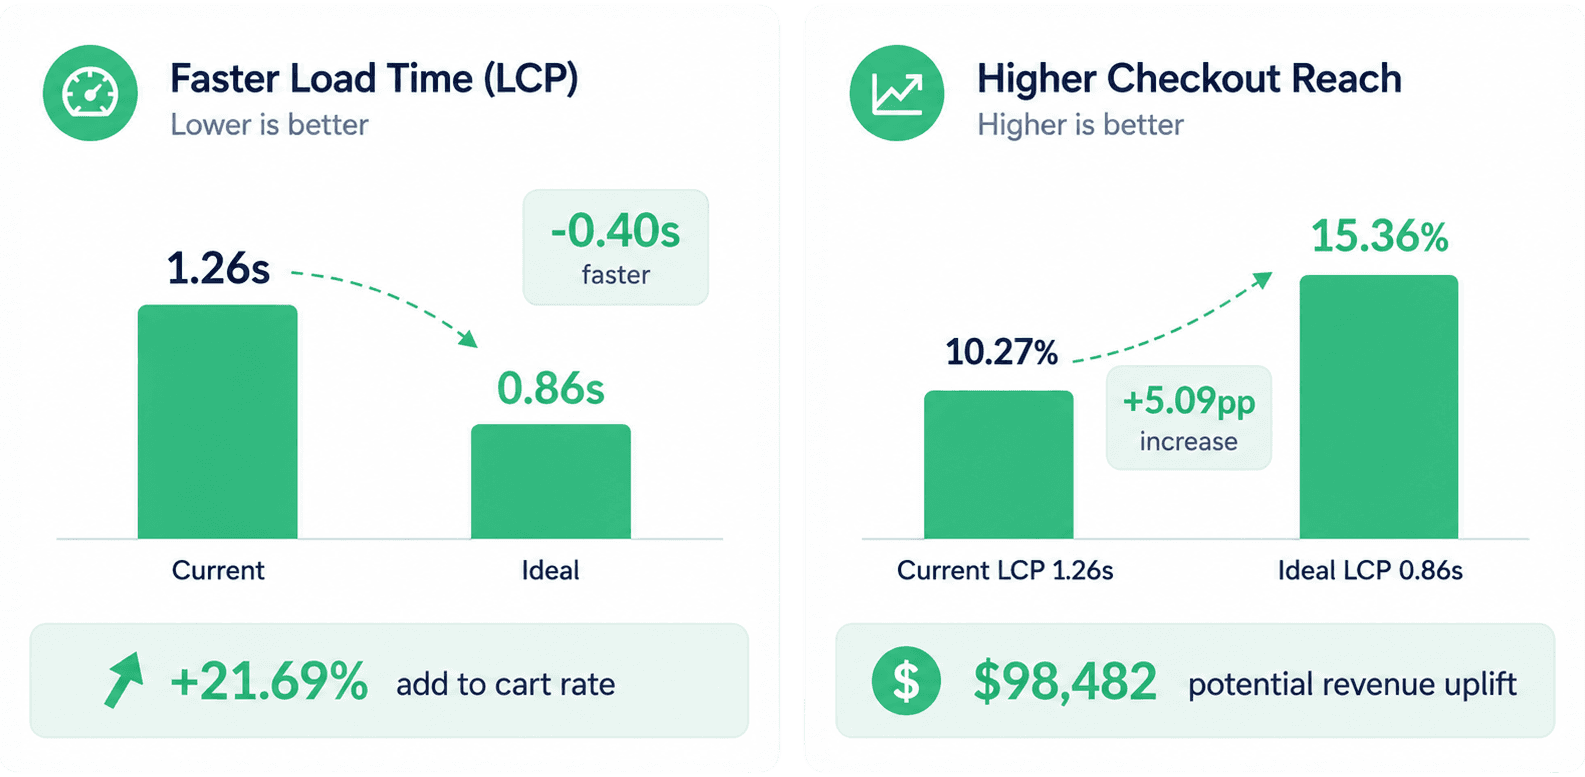
Here's where it gets interesting. Industry says LCP under 2.5 seconds is "Good." But on your checkout, conversions might stop climbing past 1.8 seconds. Reality calculates the ideal target for each metric based on your real conversion data, not generic benchmarks. So you're optimizing for the number that actually moves money, not the one in the spec.
You can also simulate fixes before you ship them. "If we cut LCP by 40% on the homepage, will the whole site pass Core Web Vitals?" Reality answers that question before anyone writes a line of code, ensuring the fixes you do make actually move the needle.
Engagement: what users do and what it means
Analytics shows you pageviews and bounce rates. Engagement shows you the 1,000+ micro-signals in between, and the behavioral cues that explain whether your site is actually working.
Reality tracks bounce rate, rage clicks, dead clicks, scroll depth, time-to-engage, form abandonment, and 20+ more metrics. Basically you have visibility into every behavior that tells you something is off before the user closes the tab.
On its own, each signal is noise. Together, mapped against conversion outcomes, they form a clear picture of where your site is working and where it isn't. The button that gets hovered but never clicked. The checkout step where scrolling quietly slows. The product page where users pause for three seconds before leaving.
Those pauses have a price and Uxify can help you find out exactly what each one is costing you. Engagement ties each signal to a real outcome, then lets you slice it across 50+ dimensions (persona, device, acquisition channel, landing page, browser, user type, time zone, hour of day, and more), so you stop chasing vanity metrics and start fixing the parts of your site that are costing you money.
And here’s a very real, very painful real-world example: paid traffic. Three channels, similar top-line conversion. Slice Engagement by channel and one stands out: those users hesitate at the pricing section twice as often and convert at half the rate. Ask Uxi explains it, Compare confirms it's the landing section, not the ad. Minutes in Reality, versus weeks of A/B testing ad creative to land the same answer.
Conversion: the metrics that match your business model
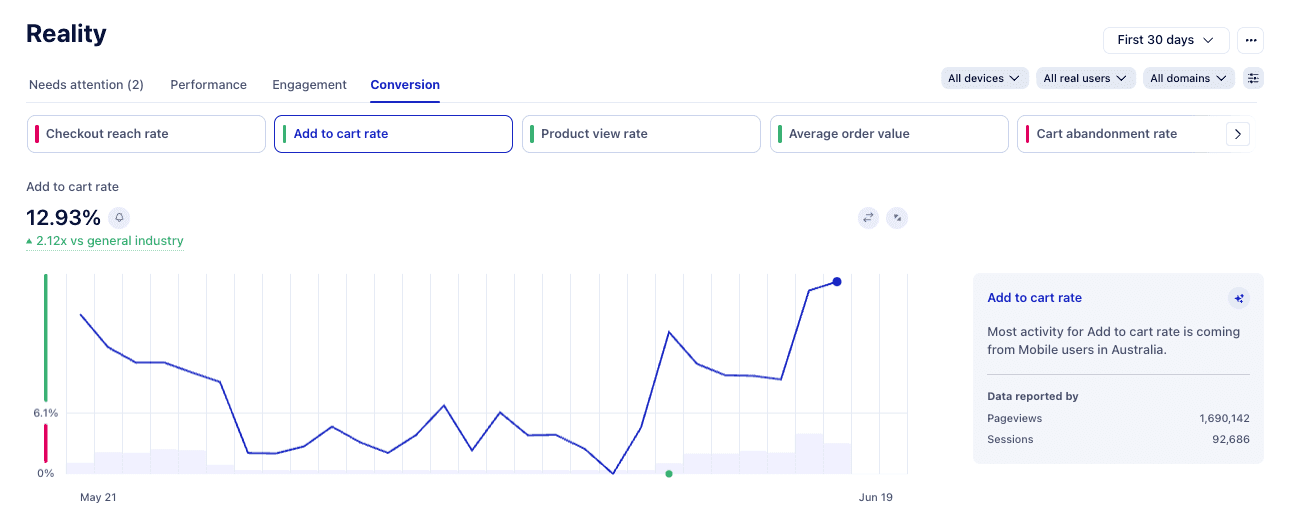
With most analytics tools, the funnel is something you have to build yourself. You define each step, tag the events behind them, and connect the whole thing to your business data before it tells you anything useful. GA4 drops you in with a generic default funnel and leaves the real one up to you. It's slow, tedious work. Reality's Conversion pillar skips it: the metrics that match your model are there from the start.
For ecommerce, that's checkout reach rate, AOV, add to cart rate, cart abandonment, and time to checkout. For SaaS, it's trial-to-paid funnels, signups, demos, and activation. For publishers and content sites, it's engaged sessions, scroll depth, and return rate. The metrics match your model, so the dashboards mean something the moment you open them.
And every conversion metric can be sliced the same way: by acquisition channel, persona, device, user spending power, UTM campaign, shopping cart, landing page, and 45+ more dimensions. You can segment further to find out what your cart abandonment rate is by channel, or your AOV by persona, your checkout completion by device. The exact slice losing you revenue is one click away.
Built into every view: simulate, compare, Ask Uxi
Three workflows show up across Performance, Engagement, and Conversion. They're not separate features, they're how Reality works.
Simulate before you ship. See the site-wide impact of a fix before you commit engineering time. Model the LCP fix on the homepage, the navigation cleanup on the checkout, the script removal across the site. Reality projects the result first, so you only build what's worth building.
Compare anything to anything. Period-over-period. With Navigation AI vs. without. Your site vs. the industry. Mobile vs. desktop. Pick any two slices and see what's actually different, not just what the average says.
Ask Uxi about any number. See a metric you don't understand? Click it and ask. Uxi is Uxify's AI agent, built directly into Reality, and it has context across your data, your filters, and your business. Ask it "which pages have the worst INP scores for mobile users this month?" or "where are paid visitors dropping off before checkout?" and it builds the chart, runs the analysis, and gives you the answer in plain language.
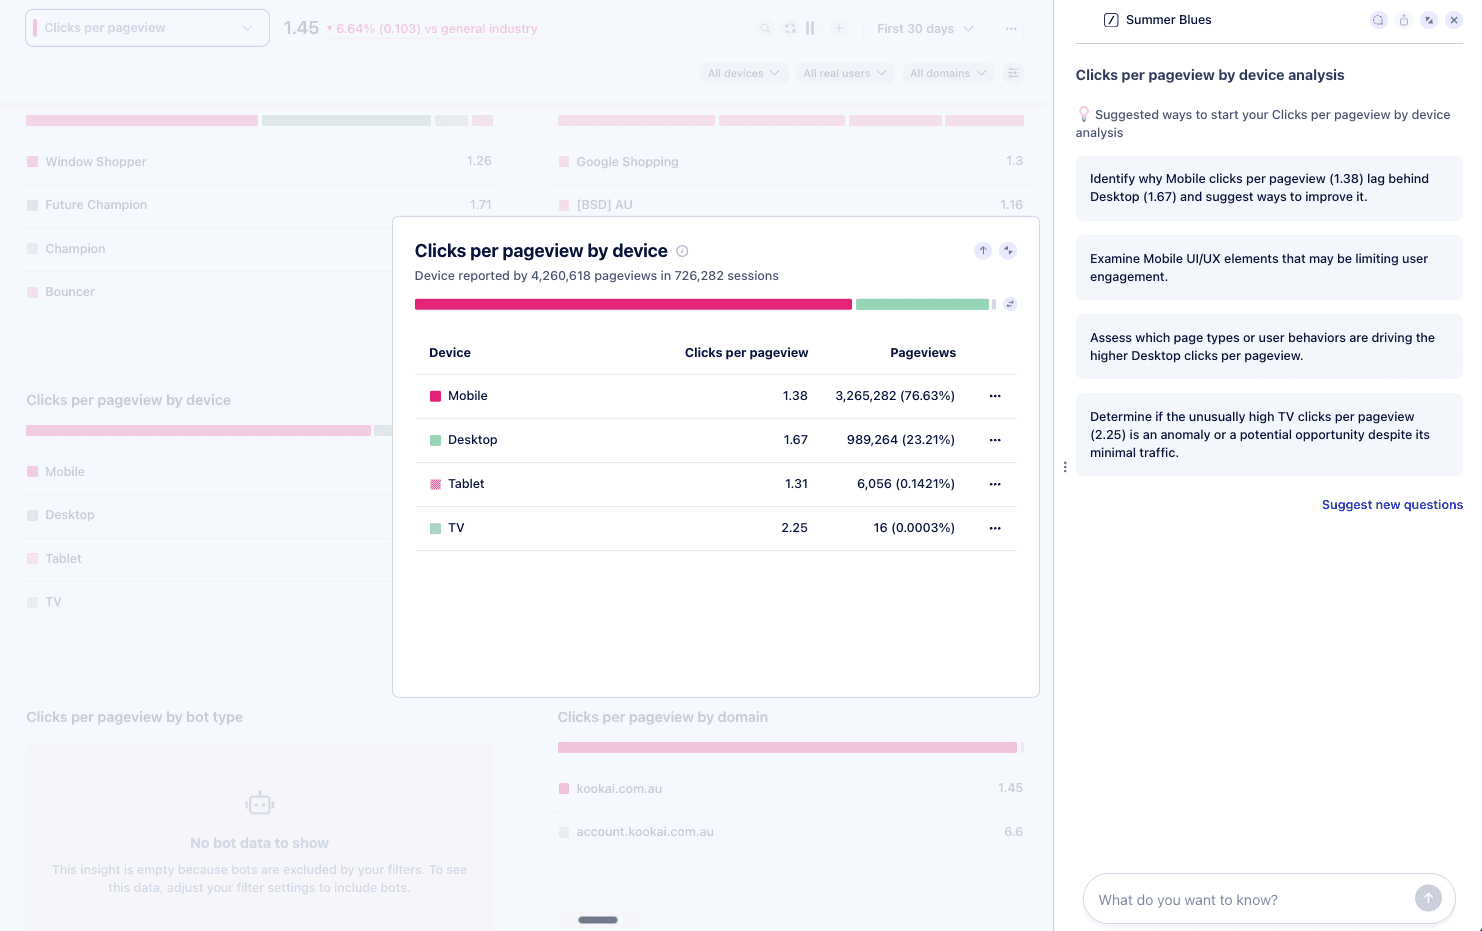
Every graph in Reality also comes with an automatic AI summary that explains what changed, when it changed, and which segments drove the change, across any time window from an hour to a year. No SQL. No data team bottleneck. No waiting for the Friday report.
Three things Reality does that you won’t find anywhere else
Targets calibrated to YOUR conversions, not Google's averages.
Every other RUM tool benchmarks you against the same number: LCP under 2.5s, INP under 200ms, same story over and over again because those are the thresholds Google publishes for the whole web. Useful as a starting point. Useless as a goal.
Reality calculates the ideal target for each metric based on your real conversion data. Maybe your checkout flatlines past 1.8 seconds? Maybe your product pages need INP under 120ms before add-to-cart rates recover? You don't have to guess and you don't have to A/B test your way to it. The number is in your data and Reality can easily spell it out for you.
Why it matters: every other tool tells you whether you're passing. Reality tells you whether you're actually selling.
Simulation that lets you cost a fix before you build it.
Engineering time is the most expensive resource a growth team has. Most RUM tools point at a problem and stop. You then spend weeks scoping, prioritizing, discussing, and shipping, only to find the LCP improvement on the homepage doesn't actually move the site-wide score the way you hoped.
Reality's Simulate workflow runs that math first. Ask "if we cut LCP by 40% on the homepage, will the whole site pass Core Web Vitals?" and Reality projects the site-wide outcome before you commit a single sprint to it. The fixes that look impressive in isolation but won’t actually lead to anything get caught in advance. The ones that you might have not expected to make an impact - those get fast-tracked.
Why it matters: you stop shipping fixes that feel right and start shipping fixes that you know will make a difference.
AI that explains every number, not just dashboards that display them.
Every graph in Reality comes with an AI summary that explains what changed, when it changed, and which segments drove the change, across any window from one hour to one year. Click any number you don't understand and Ask Uxi will dig into it in plain language, with context across your data, your filters, and your business.
That's not a chatbot nailed onto a dashboard. It's a layer that turns "the chart looks weird this week" into "INP regressed on mobile Safari starting Tuesday, isolated to the checkout, correlated with the deploy at 14:03."
Why it matters: data is only valuable when your team knows how to actually act on it. Reality removes the analyst bottleneck that sits between most teams and their own numbers.
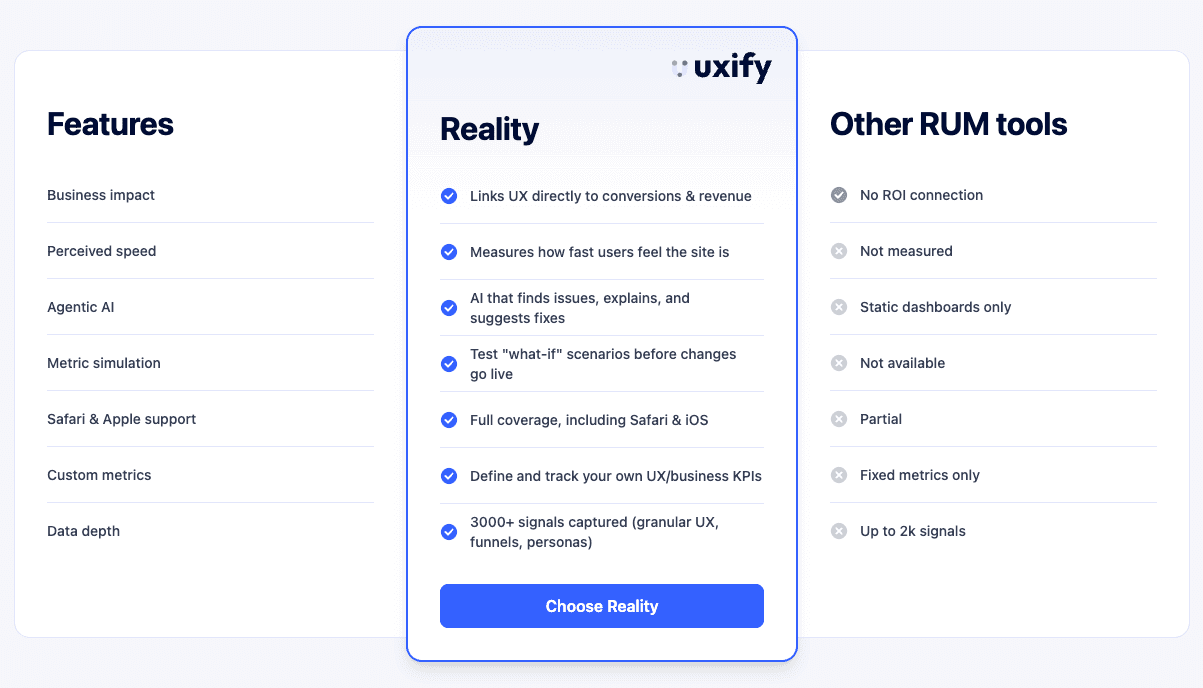
These three of Reality’s features are the ones we'd put on a billboard. But they're not the whole story. Line Reality up next to the average RUM tool on everything else, and the same pattern shows up over and over.
How Reality compares to other RUM tools
Most RUM tools were built for engineers who want to know how fast a page loads. That's a fine question, but it's not really the question a growth team is asking. The growth team wants to know what's costing them money, and that's where the gap shows up.
Take load time. Plenty of tools report it, but the most basic ones pull from CrUX, which is Chrome-only and averaged across all your traffic. Reality measures it directly on every real session, and adds perceived load speed on top, because how fast a site feels to a visitor tracks conversions more closely than a raw load number on its own.
Then there's the data problem. Most RUM tools give you hundreds of dashboards but no context, nothing tied back to your business data. So you end up in a spreadsheet, cross-analyzing exports from three tools, or hiring an analyst to do it. Reality skips all that. Ask it a question and it gathers the data, runs the analysis, and gives you the answer in seconds, plus what to fix first.
Same goes for fixes themselves. A standard RUM tool tells you something is broken and leaves you with that. Reality lets you simulate the fix and see whether it would even move the metric before you spend a sprint on it.
The TL;DR: other tools tell you whether your site is fast. Reality tells you whether it's selling.
Reality is the diagnosis layer. The agents are the action layer.
Diagnosing a problem is half the job. The other half is fixing it, and that's usually where teams struggle. The LCP is bad on mobile, but the dev sprint is full. The navigation is broken on Safari, but no one owns it. The pricing page is rage-clicked, but the next test cycle is three weeks out.
That's the gap Uxify's agentic CRO suite is built to close. Reality and AI agents work in tandem to first identify the issues and second - to fix them on the spot.
Navigation AI clears the friction out of user journeys, so visitors find what they need and actually convert. INProve keeps the site responsive, so the moment someone submits a form or places an order, the response is instant, with no lag to make them second-guess it. The full agent roster (with more launching alongside the platform) handles the optimization work that used to require a CRO consultant, a developer, and a six-week roadmap.
The architecture is deliberate. Reality is the data layer: 3,000+ signals, 60+ breakdowns, AI that explains every number. The agents sit on top of that layer and act on what Reality sees. Same signals. Same context. One platform.
For most teams, the bottleneck has never really been "we don't know what's broken." It's "we know what's broken and we can't get to it fast enough." Reality plus the agent suite removes that bottleneck, giving us agentic CRO - the next evolution of CRO, and not another buzzword.
Who Reality is built for
You don't need to be a data analyst to get value from Reality. IN fact, it’s built with the exact opposite thought - to make it useful to everyone who needs to understand where revenue comes from… or disappears into.
How ecommerce stores can use Reality
Ecommerce stores use it to find the exact friction points killing add-to-cart and checkout, and to tie every finding to lost sales rather than session metrics. Because even if a store has hundreds of thousands of sessions, if the perceived load speed is abysmal, their conversions will suffer. And that’s ultimately what every online shop cares the most about.
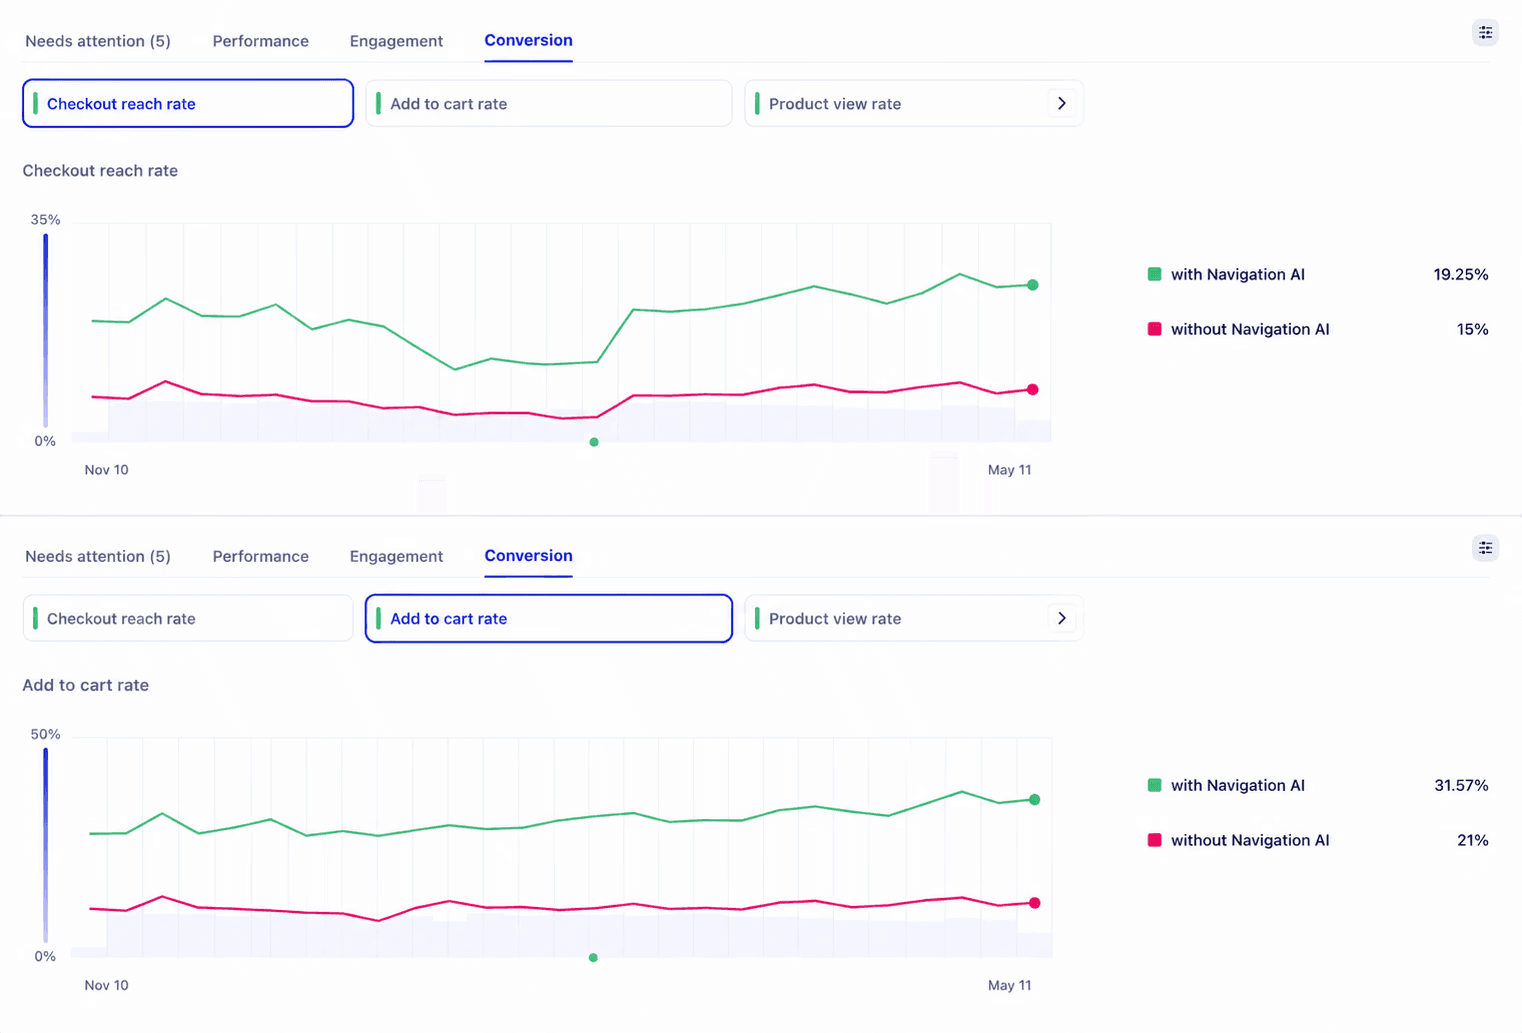
Take Ecigone, a 12-year-old Shopify store with 70+ brands, 4,000+ e-liquids, and a 4.9 Trustpilot rating built on 70,000+ reviews. The brand had plenty of monthly traffic, but wanted to ensure healthier retention rates. So the question Reality had to answer was a sharper one: where exactly was the site costing them repeat visits? The diagnosis turned into action. Customers on sessions optimized by Navigation AI browsed roughly twice as long, added to cart 50% more often, hit a 25% higher product view rate, and a 22% lift in engaged sessions. Repeat traffic climbed 9%. TTFB was cut to near-zero. And none of it would have surfaced without Reality doing the unglamorous work of watching every session and tying every signal back to what was actually moving the business.
How publishers can use Reality
Publishers and media sites use it to track engaged sessions, scroll depth, and the content patterns that drive return visits and ad revenue. Because in publishing, the whole business model rests on people staying long enough to see the ads and coming back often enough to make the next visit predictable. Reality shows them which articles, formats, and load conditions actually hold a reader, so editorial and product teams stop guessing what "good content" means and start making decisions backed by behavior.
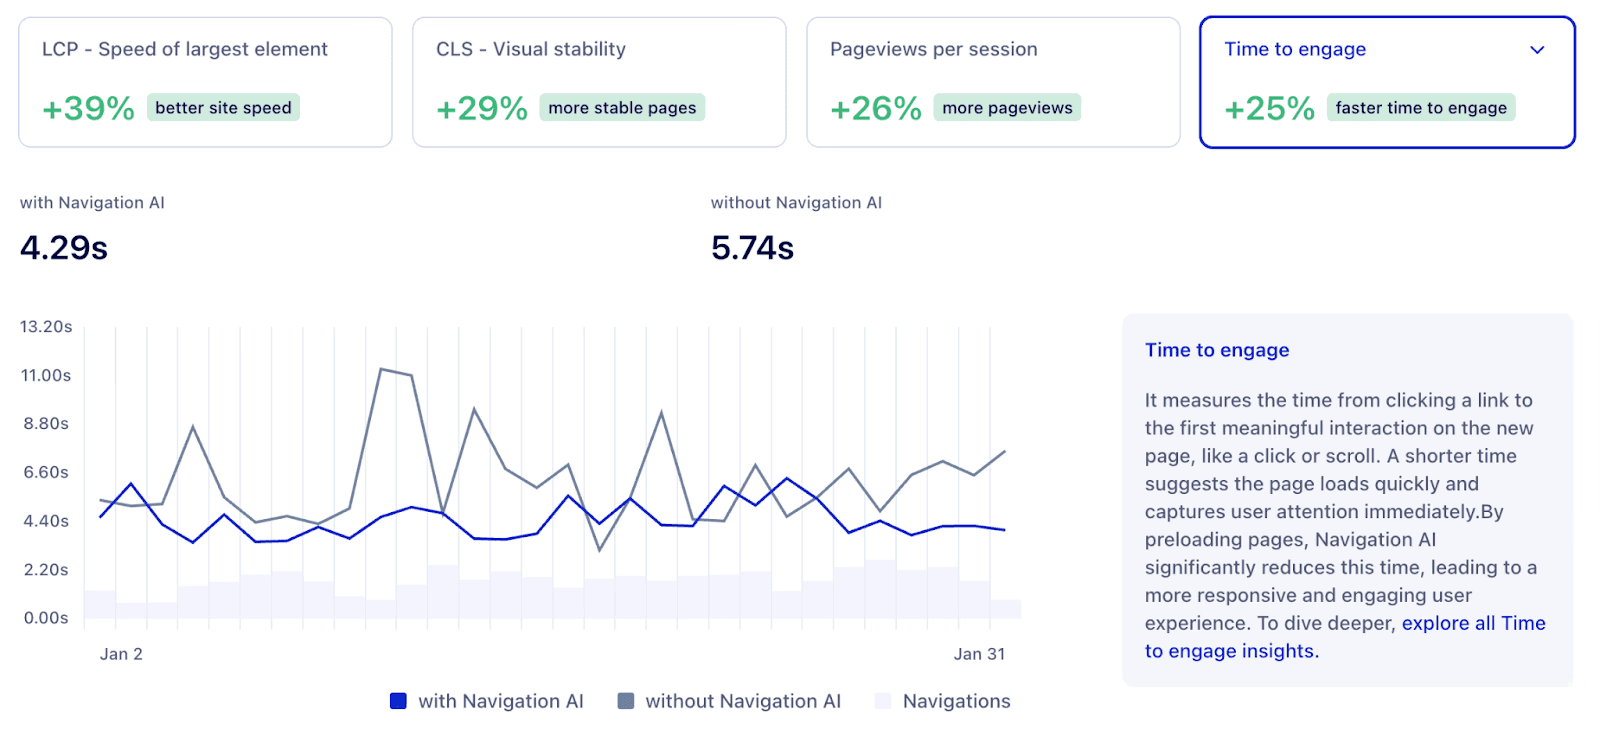
eCommerce Fastlane, the Shopify-focused publication run by Steve Hutt, is a great example of how a publisher with a massive audience was able to maximize engagement. With over 300,000 monthly visitors and a deep library of 400+ podcast episodes and guides, the problem wasn't content quality, it was readers consuming one article and leaving. Reality pinpointed the cause: micro-delays and interaction latency that were creating hesitation at the moments people decide whether to keep exploring. After acting on that diagnosis and with the help of Navigation AI and INProve, pageviews per session climbed 26%, first engagement got 25% faster, and rage clicks dropped by more than half. Same content, same editorial workflow, dramatically more reading - all optimized on autopilot.
How agencies can use Reality
Agencies use it to compress the entire CRO workflow from a multi-month engagement into something closer to a continuous loop. Reality watches every client site in real time, flags which pages and segments are bleeding conversions, and suggests the fixes most likely to move revenue. The agents act on the diagnosis: Navigation AI smoothes out user paths, INProve tightens up interaction lags, and the rest of the suite handles the optimization work that used to live in a CRO consultant's slide deck.
Then, when it's time to talk to the client, Uxify assembles the summary for you (what was broken, what changed, what the lift looks like in revenue terms) so the account manager isn't spending a Sunday rebuilding charts before the call.
For an agency, that changes the workflow. Reporting that used to eat hours gets handled, so the client meeting moves from explaining performance gains to showing them: a conversion lift, a competitor gap that closed, a friction point fixed, in numbers the client actually recognizes. And because the platform watches continuously instead of in quarterly bursts, wins show up steadily rather than waiting on the next big audit.
The value is the same in every case: what was invisible becomes visible, and what was guesswork becomes evidence you can then operate on with confidence… or let Uxify’s agents do that for you too.
How SaaS teams can use Reality
SaaS teams use it to understand where trial users stall or which paid campaigns actually convert to demos. They can then use this knowledge to improve the onsite messaging, upgrade the product offering, or ensure the onboarding is tight - and invest time in changes that will actually drive the numbers in a positive direction.
Conclusion
There are two versions of your website. The one you see, in staging, on your own fast laptop, in the QA pass you did last Thursday. And the one your users actually experience. Reality bridges the two, so the website your visitors experience can live to be the best version of itself. It overlooks your website from three perspectives: performance, engagement, and conversion, built from over 3,000 unsampled signals for every real user. You can slice any metric more than sixty ways, and when a number doesn't make sense, an AI agent explains it in plain language. From there, the workflows and agents take you from diagnosis to action.
The teams who convert more, rank higher, and respond faster to regressions aren't guessing. They're watching what’s going on on their website in real time.
Frequently Asked Questions
Can Reality explain why a metric changed?
Yes. Every graph in Reality comes with an AI summary that explains what changed, when it changed, and which segments drove the change for the selected metric, filters, and time range, from the last hour to the last year. You can also one-click Ask Uxi for deeper follow-up questions on any number you see.
How is Reality different from Google Analytics?
Google Analytics is built to count what happened: pageviews, clicks, sessions. It doesn't tell you how the page actually performed for that user, why they dropped off, or what it cost you. Reality uses unsampled, real-user data and ties every technical metric (LCP, INP, CLS, TTFB, PLS) to engagement and revenue, then highlights the segments and pages actually costing you conversions.
Do I need a developer to set up Uxify Reality?
No. Reality uses a standard tracking script, similar to Google Analytics, with no custom event configuration to start getting value. It also supports automatic installation through Google Tag Manager. Setup takes under two minutes, and Ask Uxi starts surfacing insights as soon as data begins flowing.

" height="200.00000219726564px" id="j9Mmwfnw8" transform="translate(143.5 0)" width="479.5329973144531px"/><path d="M 0 15.944 C 0 7.139 7.154 0 15.98 0 C 24.804 0 31.959 7.138 31.959 15.943 L 31.959 59.637 C 31.959 68.442 39.113 75.58 47.938 75.58 C 56.763 75.58 63.917 68.442 63.917 59.637 L 63.917 15.944 C 63.917 7.139 71.071 0.001 79.897 0.001 C 88.721 0.001 95.875 7.139 95.875 15.944 L 95.875 56.095 C 95.875 82.51 74.413 103.923 47.938 103.923 C 21.462 103.923 0 82.51 0 56.095 Z" fill="rgb(59, 63, 91)" height="103.923px" id="KJCDMITFE" transform="translate(0 53)" width="95.875px"/><path d="M 0 15.943 C 0 7.138 7.154 0 15.979 0 C 24.804 0 31.958 7.138 31.958 15.943 C 31.958 24.748 24.804 31.886 15.979 31.886 C 7.154 31.886 0 24.748 0 15.943 Z" fill="rgb(252, 200, 0)" height="31.885999999999996px" id="q2K9EYOvZ" transform="translate(0 53)" width="31.95799999999963px"/><path d="M 0 15.943 C 0 7.138 7.154 0 15.979 0 C 24.804 0 31.958 7.138 31.958 15.943 C 31.958 24.748 24.804 31.886 15.979 31.886 C 7.154 31.886 0 24.748 0 15.943 Z" fill="rgb(63, 184, 126)" height="31.885999999999996px" id="bBya7XCj7" transform="translate(64 53)" width="31.95799999999963px"/><path d="M 0 14.171 C 0 6.344 6.359 0 14.204 0 C 22.048 0 28.407 6.344 28.407 14.171 C 28.407 21.997 22.048 28.342 14.204 28.342 C 6.359 28.342 0 21.997 0 14.171 Z" fill="rgb(229, 0, 106)" height="28.341999999999985px" id="WNzwBFOi7" transform="translate(34.5 128.5)" width="28.407000000000153px"/></g></svg>)