In a world where every second counts, your website's speed, stability, and responsiveness can make all the difference. Google has set the spotlight on three key players: Loading Speed, Layout Stability, and Responsiveness. These metrics aren't just tech jargon; they are the heartbeat of a great online experience.
Dive in and discover everything you need to know about the latest trends in Core Web Vitals optimization. With insights into the evolving landscape of web performance, you'll be equipped to stay ahead of the curve and enhance your site's user experience.
Why Core Web Vitals
Core Web Vitals are the key metrics that Google uses to evaluate your website’s performance from a user’s perspective. They zero in on three crucial areas:
Loading speed (Largest Contentful Paint, or LCP): How fast does the main content appear on the page?
Layout stability (Cumulative Layout Shift, or CLS): Does the content shift its position on the page while it loads?
Responsiveness (Interaction to Next Paint, or INP): How quickly does your page react to user actions?
To accurately reflect the user experience, Core Web Vitals are based on real-world data collected from actual user interactions. These stats come from the Chrome User Experience Report (CrUX), which gathers feedback from Chrome users who opt to share their experiences. This data-driven approach is what makes the program so effective, empowering site owners to enhance their websites based on real user interactions.
Since May 2021, mobile page experience has played a vital role in search rankings, with desktop signals joining the game in February 2022. This shift emphasizes that optimizing both mobile and desktop user experiences is essential for success. By focusing on enhancing Core Web Vitals for every device, site owners can align with Google's evolving criteria and elevate their visibility in search results. The message is clear: a stellar user experience across platforms is key to winning the ranking race.
The evolution of CWVs
Right now, the key Web Vitals are LCP, INP, and CLS, but these metrics are not set in stone. Google is continuously refining how it measures user experiences, exploring ways to enhance and combine metrics for a more accurate understanding. This commitment to evolving measurement criteria underscores the importance of staying updated on what matters most for user engagement and satisfaction. As the digital landscape shifts, so too will the metrics that define success.
Here is a brief record of how Google has evolved the metrics:
May 2020: Google announced the Core Web Vitals initiative to enhance user experience.
September 2021: Completion of the page experience update, initially focusing on mobile SEO.
February 2022: Expansion of page experience ranking signals to desktop, fully rolled out by March 2022.
Ongoing Developments: Google continually tests and refines CWV metrics, including plans for a new smoothness metric for animations.
March 2024: Transition from First Input Delay (FID) to Interaction to Next Paint (INP) as a key metric.
Why are the Core Web Vitals important
Enhancing your Core Web Vitals isn't just about meeting Google's standards; it's essential for boosting visitor engagement and increasing conversions. Research from Deloitte and Google reveals that even a minor improvement of 0.1 seconds in page speed can transform the entire buyer journey, leading to significantly better customer experiences.
Check out T-Mobile's recent case study showing a 20% reduction in in-site issues and a 60% increase in their visit-to-order rate, thanks to their focus on user experience and Core Web Vitals.
Core Web Vitals impact on your business’s bottom line
Google’s focus on Core Web Vitals is backed by in-depth, real-world studies on how these metrics affect key business outcomes. Insights gathered from over a dozen renowned global brands reveal the following:
Elevated User Experience: When you optimize Core Web Vitals, you're not just speeding things up; you're creating a smoother, more enjoyable journey for your visitors. Think of it as rolling out the red carpet for a VIP user experience.
Enhanced Search Visibility: Google is like a talent scout, and it loves sites that perform well. Passing Core Web Vitals scores boosts your search rankings, while slower sites may fall behind.
Higher Engagement Rates: Sites that load in under 2 seconds keep users hooked. Who doesn’t want to lower bounce rates and see more people diving into their content?
Increased Conversions and Revenue: Stellar Core Web Vitals results mean more visitors turning into customers. For ecommerce stores, optimized performance directly translates into smoother checkouts and higher conversions.
Cultivated Customer Loyalty: When users have a fast and responsive experience, they're more likely to stick around and come back for more. By smoothing out those bumps in performance, you're building a community of loyal fans.
CWV impact on your site’s SEO
In today’s fast-paced digital landscape, page load speed is crucial for SEO and staying competitive. With Google spotlighting Core Web Vitals, the message is clear: fast, user-friendly sites get the edge. Quality content remains king, but as users grow impatient, optimizing for Core Web Vitals can set you apart in crowded markets.
As John Mueller pointed out, it’s not just about attracting traffic; it’s about converting it. When your site is quick and pleasant to use, everyone wins—Google loves it, and so do your visitors!
Now that we've established the importance of Core Web Vitals for user experience, competitiveness, and profitability, let’s delve into what each metric truly measures. By understanding these specifics, we can make precise improvements that enhance both site performance and user satisfaction.
What is Largest Contentful Paint?
Largest Contentful Paint (LCP) is all about speed and capturing the moment your page’s main content is ready for viewing. LCP measures how fast the largest visible element, like a headline or a key image, loads within the viewport—signaling your website is visually ready for users to dive in. Optimizing LCP can keep users engaged by improving their first impression of speed and usability.
Common elements that contribute to LCP include:
Header images or image groups (sliders): These are typically rendered as <img> tags.
Background images
Large text blocks, such as the H1 tag on your pages
Think of the LCP as the biggest element that needs to load on your page and is typically positioned above the fold or close to it.
What is a ‘Good’ LCP score
To get a Pass, your LCP should be under 2.5 seconds for at least 75% of page loads. Pages that achieve this offer a "Good" experience, indicating that key content appears quickly. If your LCP falls between 2.5 and 4.0 seconds, it "Needs Improvement," while anything over 4.0 seconds is considered "Poor." Hitting the "Good" target ensures a faster, more engaging experience, helping keep visitors on your site and boosting your performance in Google’s eyes.

Source: web.dev
How to see the LCP element
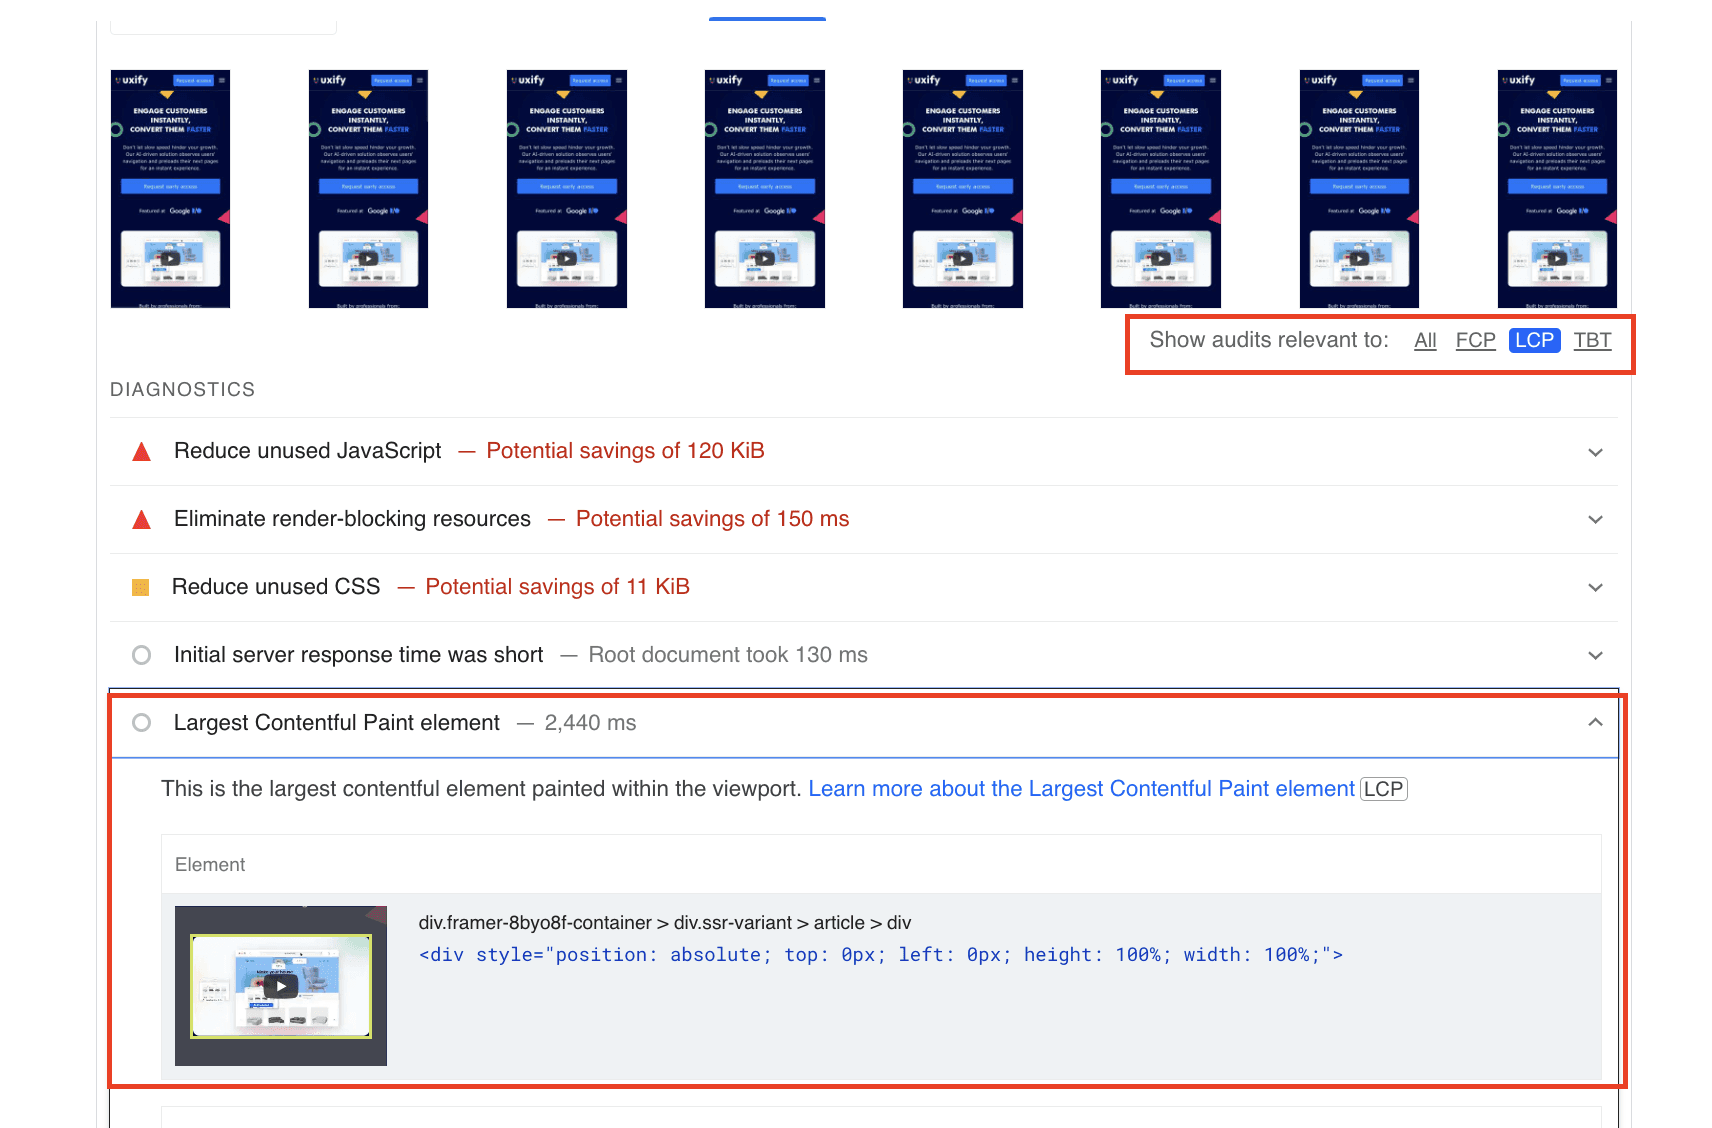
To pinpoint your Largest Contentful Paint (LCP) optimizations, jump into PageSpeed Insights. Go straight to the "Diagnostics" section, where your key LCP element is identified, and check out the specialized LCP issues tab. This layout guides you directly to problem areas, helping you streamline improvements and get your content loading at peak speed for an enhanced user experience.
Why is LCP important
To ensure a great experience for your site visitors, it's crucial that your pages load quickly and deliver the information they need right away. A slow-loading page can easily frustrate users and drive them away.
Imagine a shopper on your site, ready to buy the latest smartphone. If your page lags, they’ll likely abandon their cart and move on to a competitor’s site that gets them to checkout quickly. Prioritizing speed isn't just a technical win—it’s key to boosting sales and keeping customers!

To explore how to optimize your LCP score, improve your site’s speed, SEO, and boost conversions, check out our comprehensive guide on LCP Optimization: How to Boost Site Speed, SEO & Conversions.
What is Interaction to Next Paint?
Interaction to Next Paint (INP) measures how smoothly a webpage responds to user interactions throughout their visit. Using data from the Event Timing API, it records the delay for each click, tap, and keypress, then scores the page based on the longest interaction delay.
For most sites, INP is based on the interaction with the worst latency, showing how slow the site could feel during its least responsive moment. However, for pages with many interactions, one or two random, high-latency events could skew the results.
To avoid this, INP ignores the single worst interaction for every 50 interactions on pages with a high volume of user actions. This adjustment keeps the measurement fair and focused on typical responsiveness. The 75th percentile of all INP values is then used, further smoothing out outliers and giving a value that reflects the experience of most users. An interaction, like a tap on a touchscreen, involves multiple events (e.g., pointerup, pointerdown, and click), and INP focuses on the longest delay within this group, from the start of the interaction to when the browser can paint the next frame.
(!) Keep in mind: INP doesn’t track hovering or scrolling, so it’s focused on how quickly your page handles direct user actions, giving insight into the overall responsiveness of your site.
What is a ‘Good’ INP score
A lower INP score indicates a faster, smoother experience, enhancing user satisfaction. For optimal performance, aim for an INP of less than 200ms for 75% of recorded page loads to stay in the green zone.

Source: web.dev
Why is INP important
In March 2024, Google introduced Interaction to Next Paint (INP) as the newest Core Web Vital, replacing First Input Delay (FID).
Unlike FID, which only measured the delay of the first interaction, INP captures responsiveness across all interactions throughout a user’s session.
This shift provides a much clearer view of user experience, focusing on how responsive a page is beyond the first click or tap, making it easier to understand and optimize engagement throughout the entire visit.

INP across all browsers
Back in 2025 at Interop it was announced that LCP & INP will be coming to Safari & Firefox. As of December 2025 this is a reality. INP can now be measured in current versions of all major browsers. While it seems that there are still some hiccups in the Safari measurement, performance professionals can choose to implement the INP polyfill for Safari for more precise data.
What is Cumulative Layout Shift?
Cumulative Layout Shift (CLS) captures how much content unexpectedly moves around while a page loads, impacting visual stability.
Common culprits behind CLS include:
Images that lack defined dimensions
Ads, embeds, and iframes without specified sizes
Injecting content dynamically with JavaScript
Late application of fonts or styles during the loading process
What is a ‘Good’ CLS score
Google calculates your CLS score by asking two key questions:
How much of the screen was affected?
How far did elements move around?
Your final CLS score is the sum of these shifts, with a goal to stay under 0.1 for a smooth, stable experience. Hitting this mark means your page loads predictably and without surprise jumps.

Source: web.dev
How to see the CLS element
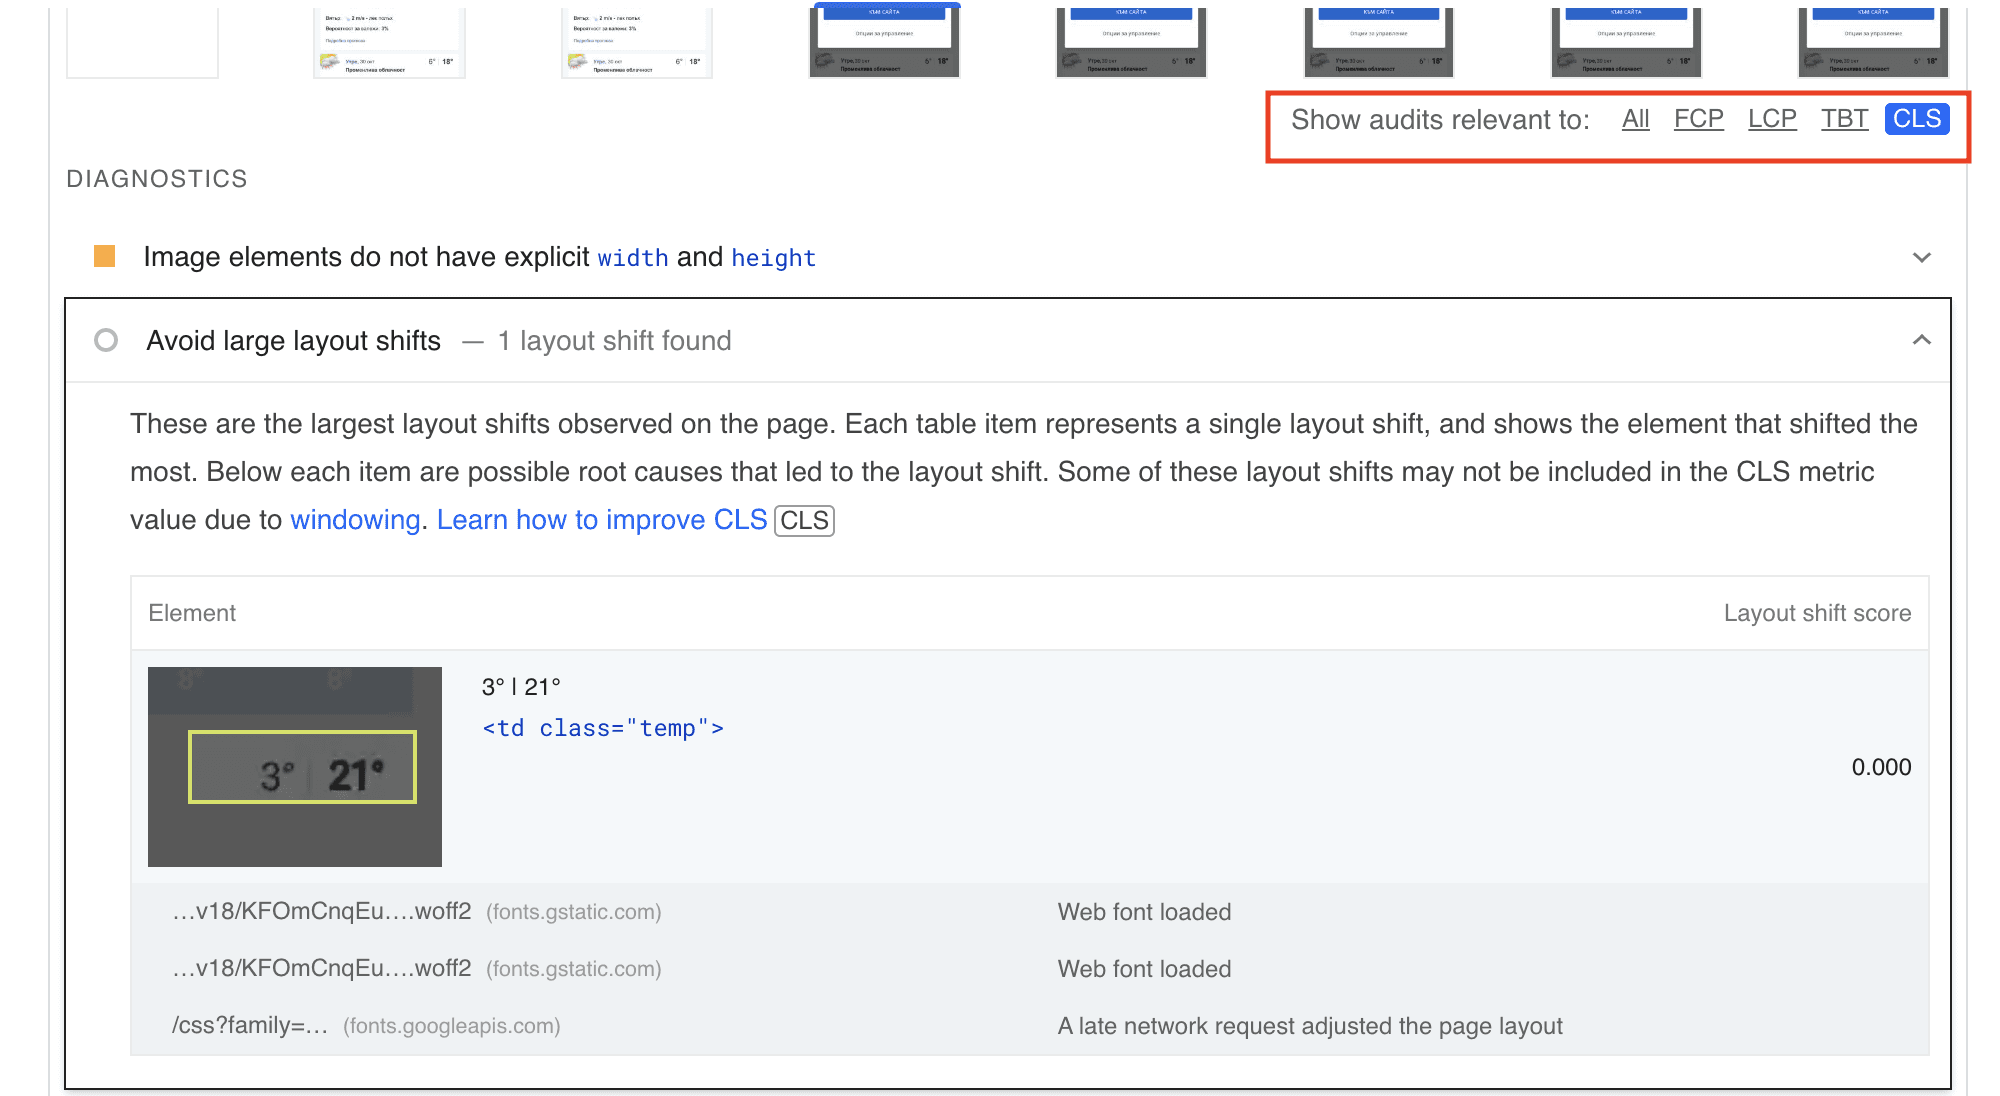
In PageSpeed Insights, selecting the CLS metric helps you zoom in on layout stability issues, with “Avoid large layout shifts” as the key area to focus on.
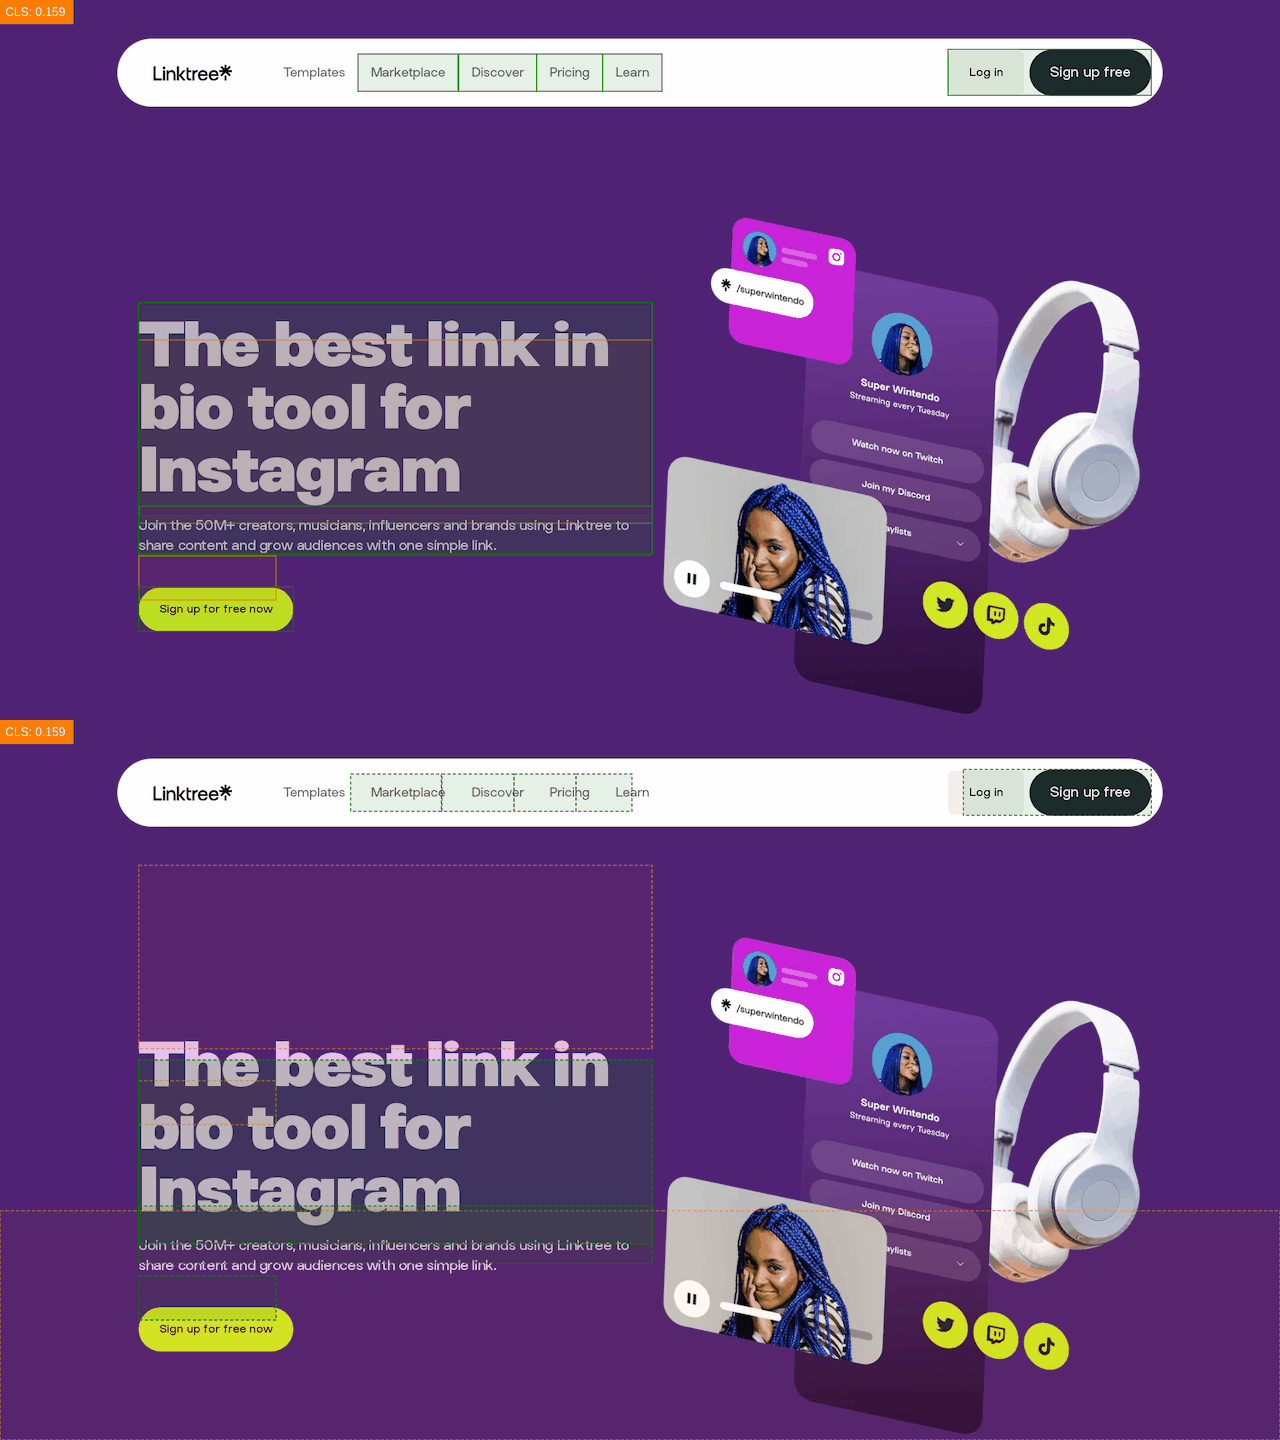
For a more hands-on approach, try using a CLS generator. This tool highlights areas where layout shifts happen and calculates your overall CLS score, helping you tackle visual stability challenges effectively.
Why is CLS important
CLS measures how stable your page layout is as it loads. When elements hold their place, users can easily interact with buttons, links, or forms without the annoyance of unexpected shifts.
This visual stability is crucial for any site, but especially for online stores—where a seamless experience can make or break a sale! A solid CLS score helps customers browse and purchase with ease, supporting a smooth, reliable shopping journey.
Learn more about optimizing CLS
To dive deeper into stabilizing your website layouts and boosting your site’s performance, check out our detailed guide on CLS Optimization: How to Stabilize Layouts, Improve SEO & Boost Conversions.
Testing your Core Web Vitals
To kick off your journey in optimizing Core Web Vitals, it’s all about measuring where you stand right now. Understanding your site’s performance is key! Luckily, there are many user-friendly tools out there that make this process a breeze. These testers help you dive into important metrics like LCP, INP, and CLS, so you can spot what needs to be improved.
Let’s explore the most popular and user-friendly tools to check your site’s performance.
PageSpeed Insights
PageSpeed Insights (PSI) is a dream tool for any beginner looking to speed up their site. It’s Google-made, free, and always updated—perfect for testing how fast your pages load on both mobile and desktop.
In short, Google's PageSpeed Insights is both powerful and easy to use:
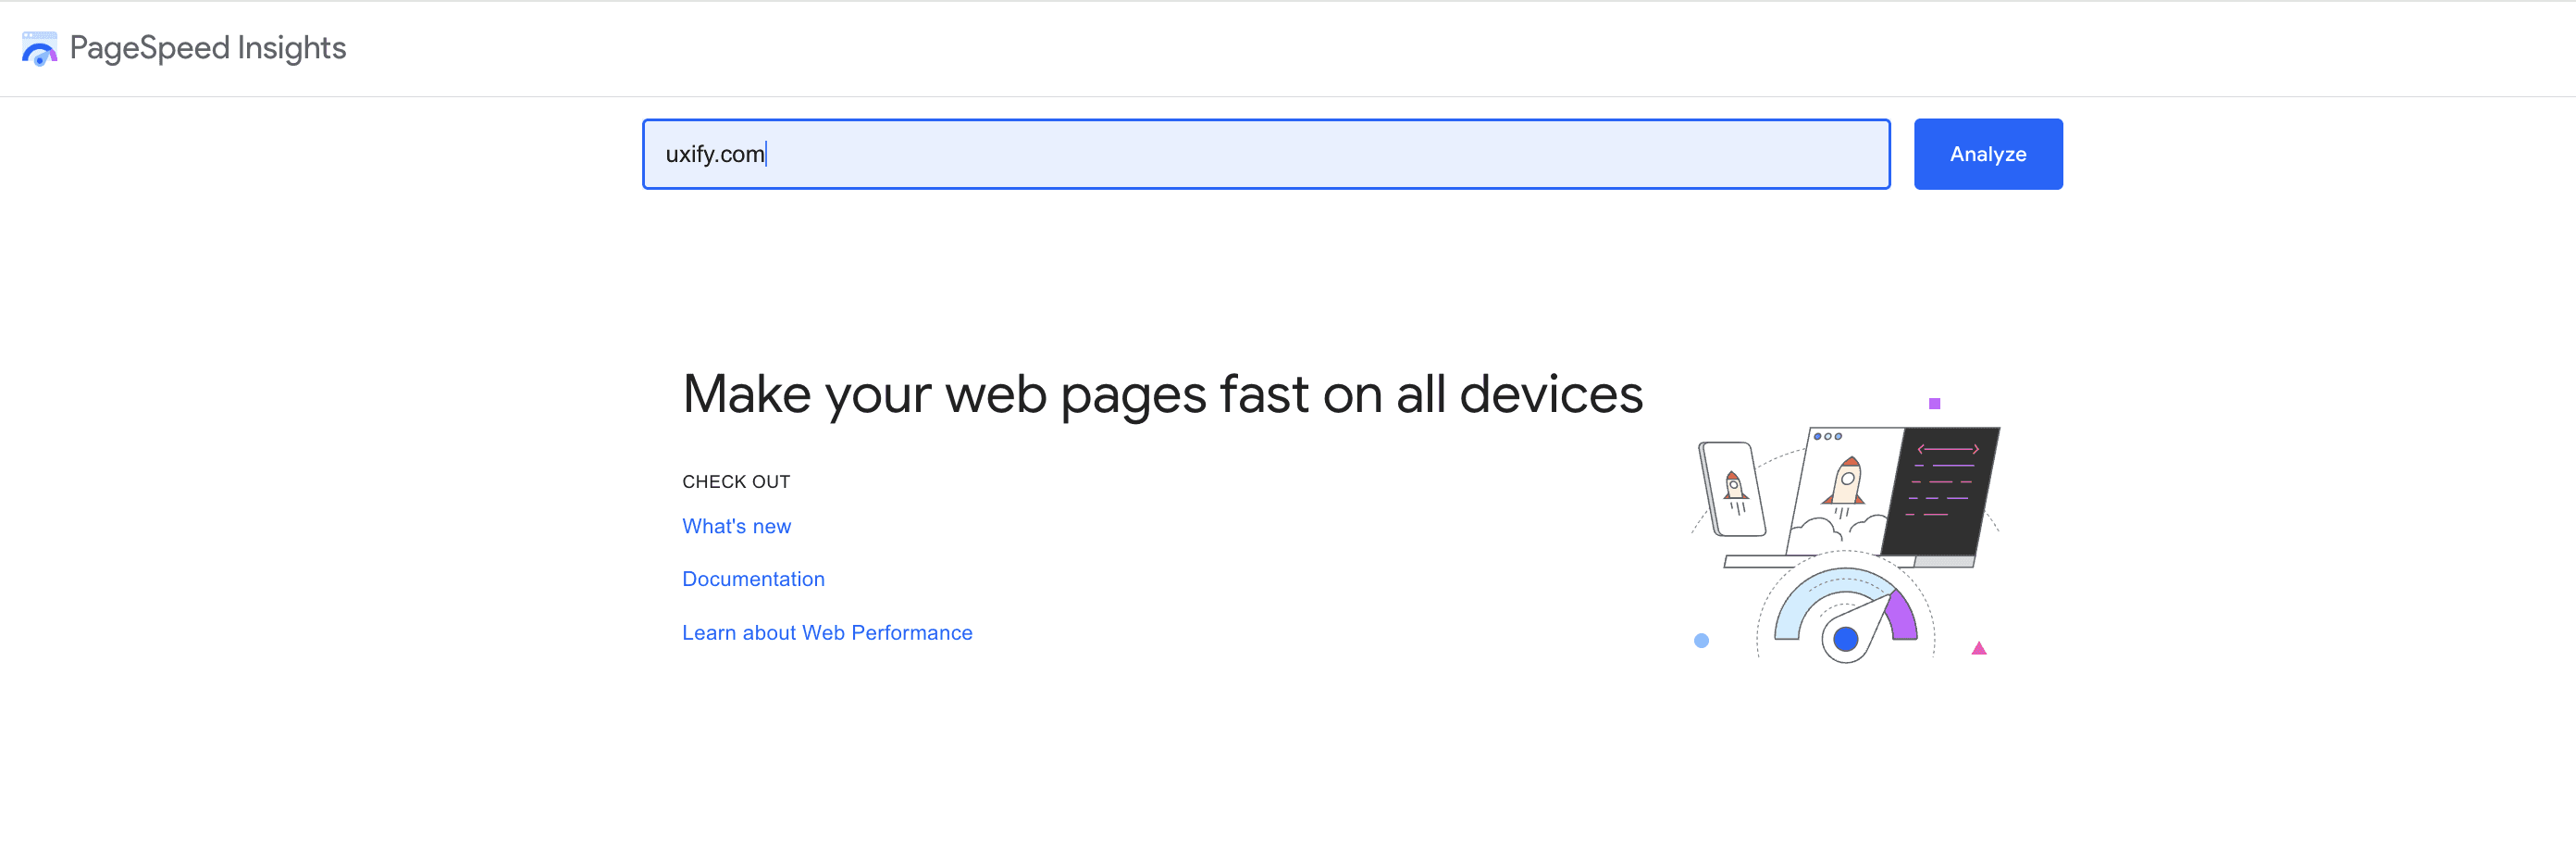
You only need to type-in the URL you’d like to test to get the full report.
The report is fairly easy to understand, classifying user experience in three buckets: Good (green), Needs Improvement (amber), or Poor (red).
Core Web Vitals section
At the very top of the report, you’ll see all Core Web Vitals measurements for the tested page.
⚠️ The data here is based on real-user experiences over the last 28-days. Google gathers these in the Chrome User Experience Report dataset. Hence, 28 days is the optimal time needed to see changes in your CWV scores after implementing any performance optimizations.
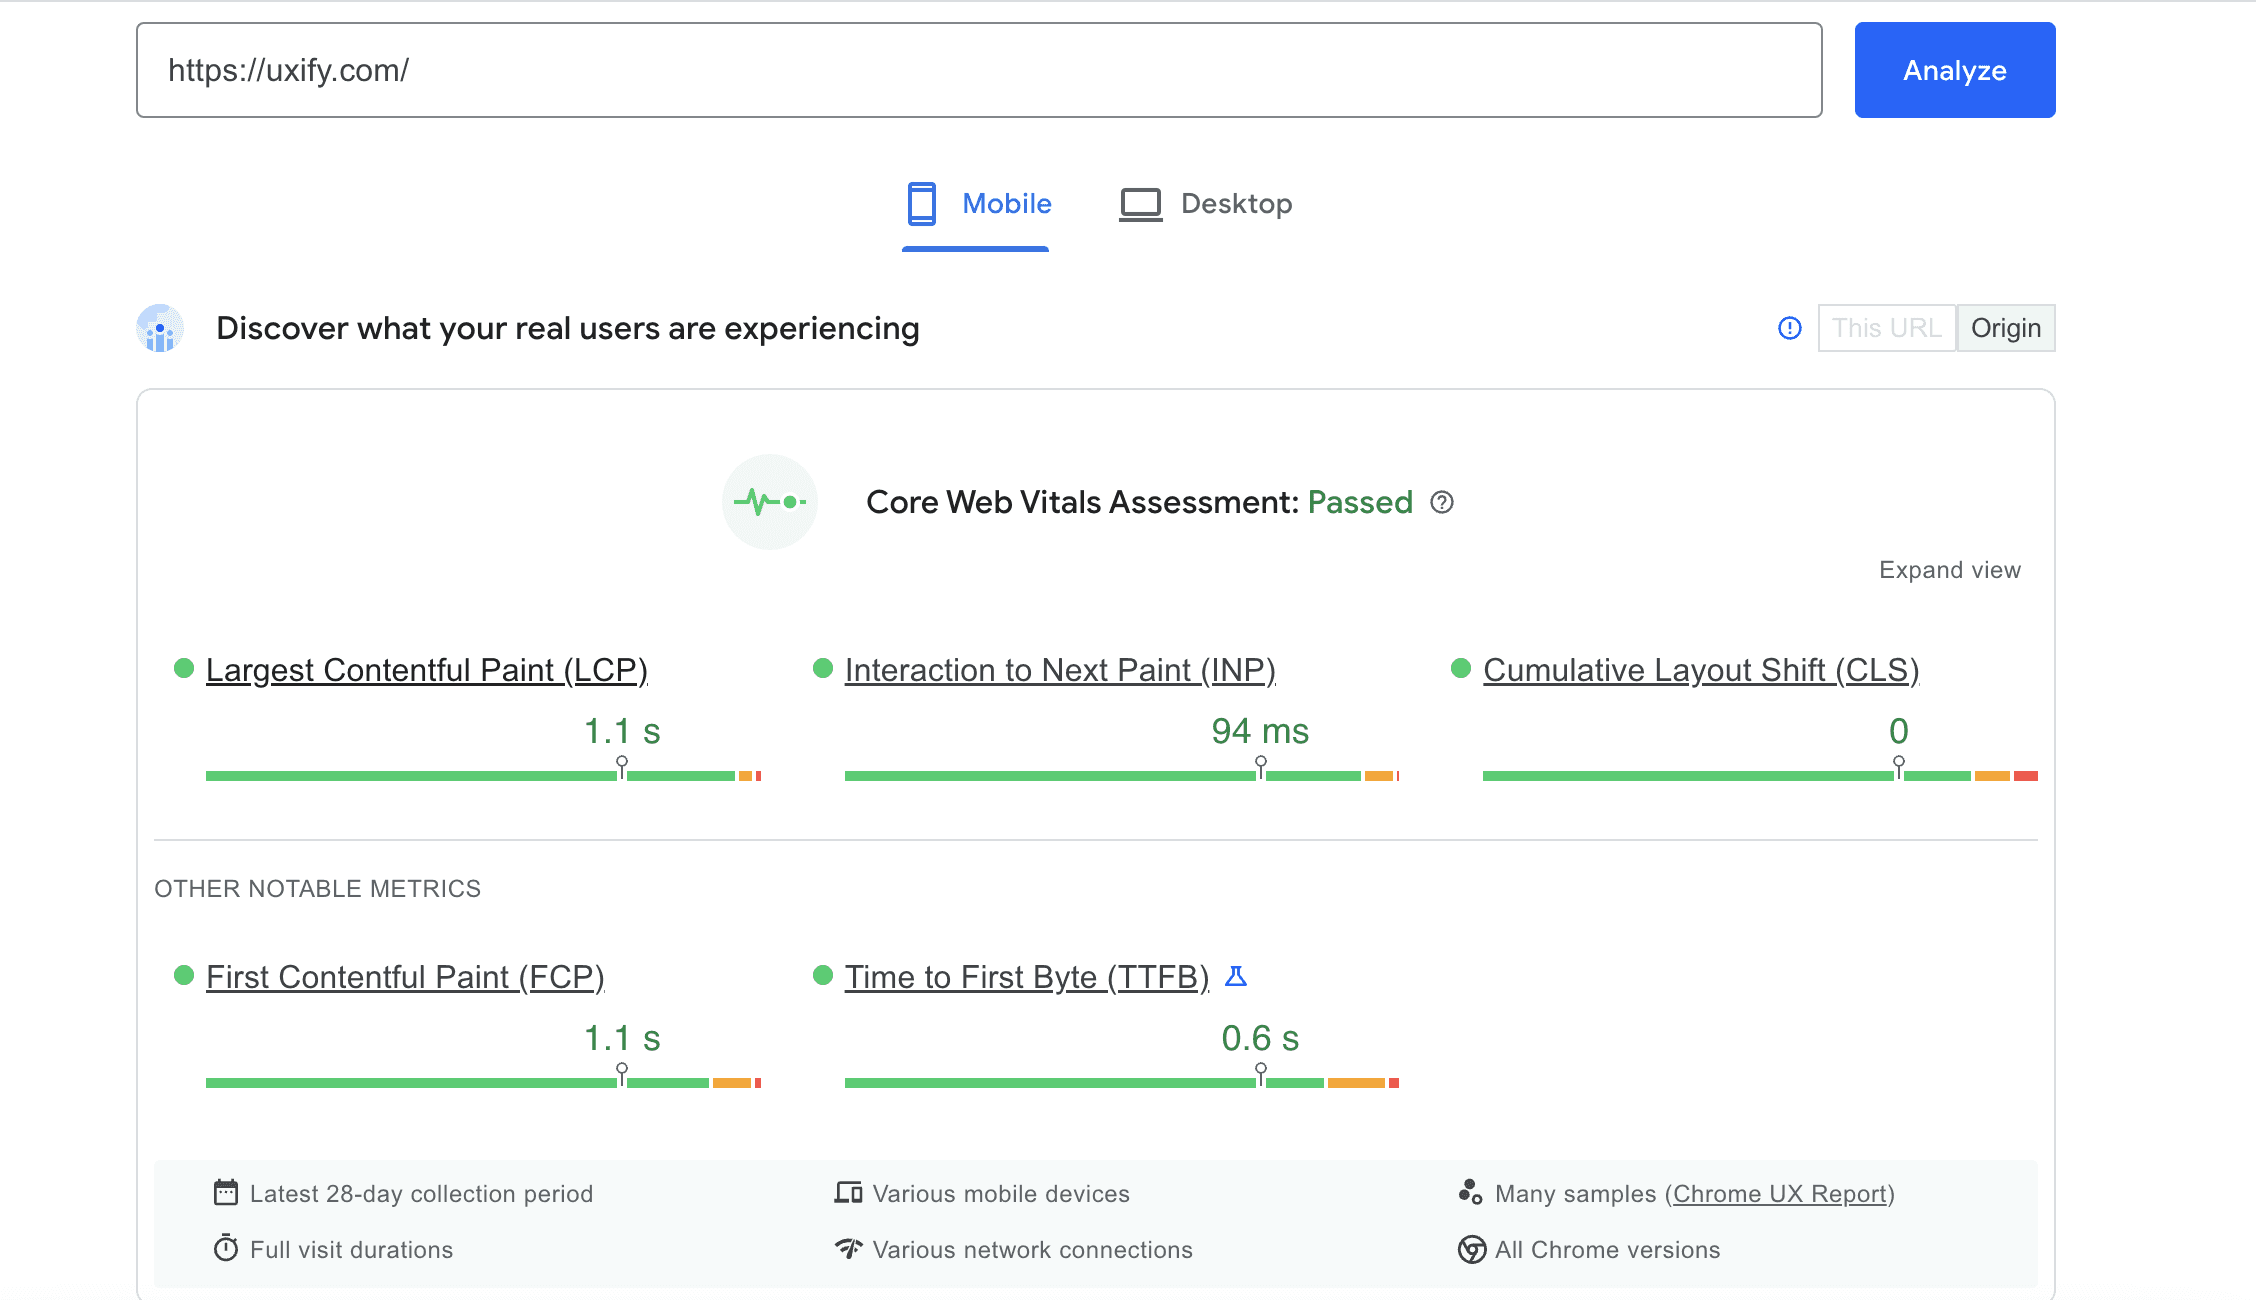
You can switch between mobile and desktop results for a clearer view of how users experience your site on different devices.

Also, at the top right corner of the panel, you’ll see two views to switch between: This URL and Origin.
This URL displays Core Web Vitals results for the specific page you’re testing in PageSpeed Insights.
Origin shows results for the entire domain
Finally, if your site is new or has low traffic, this section of the report might not be available. This occurs when CrUX hasn’t gathered enough data due to limited visitors. In such a case, you can still use the report’s lab (synthetic) data to gauge how your site is performing.
Diagnostic section
What makes Google PageSpeed truly valuable is its ability to help you identify specific issues. Think of it as your site’s personal advisor, helping you refine performance so users stick around and enjoy a seamless, speedy experience.
The Diagnostics section helps you pinpoint exactly what's affecting your site's performance by analyzing lab data. With these insights, you can focus on the factors that have the biggest impact on your scores, allowing you to fine-tune your site for the best possible user experience. It evaluates your performance via Google's Page Speed score from 0 to 100.
⚠️ Lab data represents how predefined users might interact with your website. It is gathered in a controlled environment and is valuable for debugging performance issues.
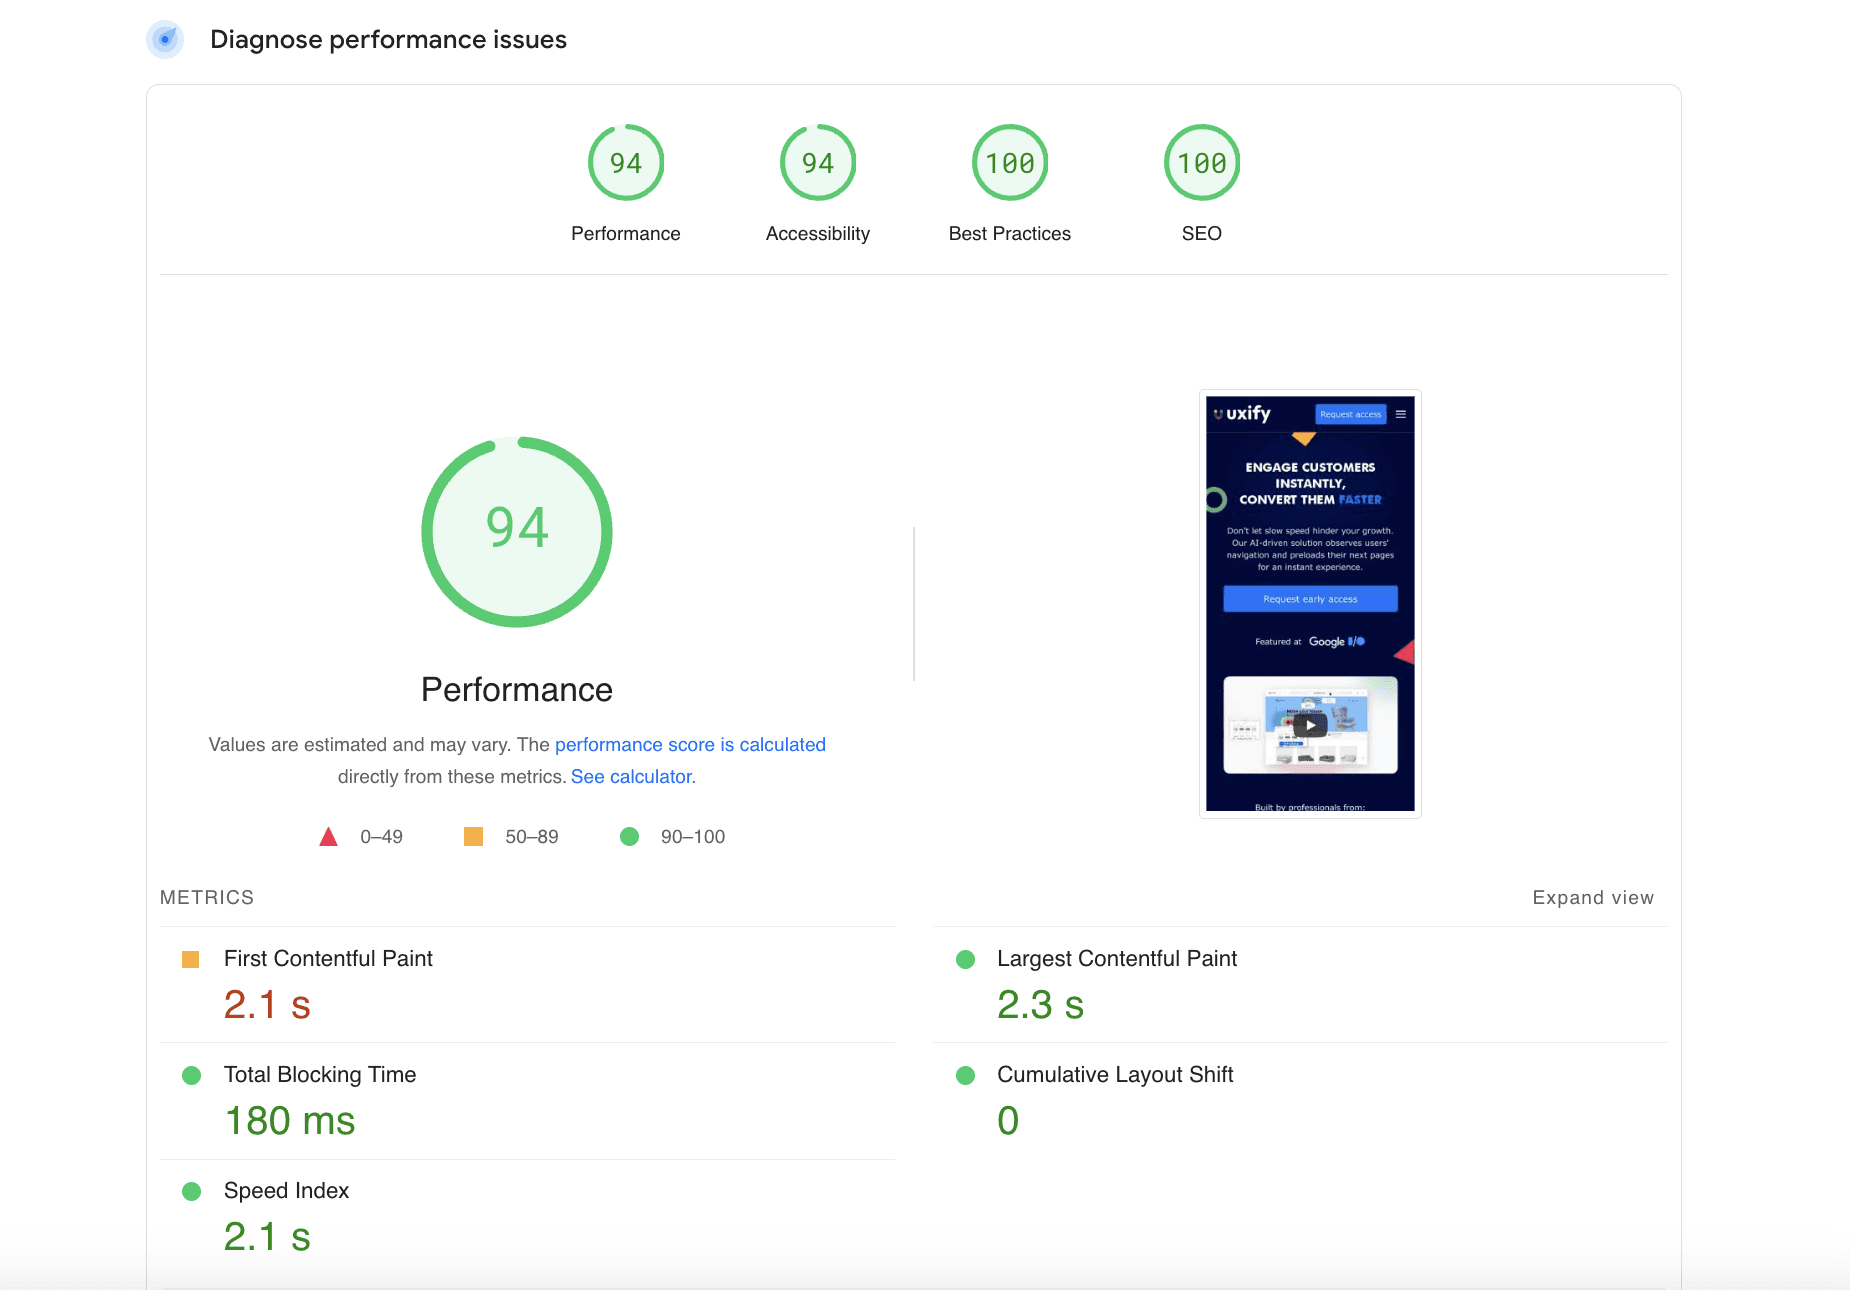
You can access the diagnostics list beneath your Performance score and even filter between audits specific to FCP, TBT, LCP and CLS.

Google Search Console
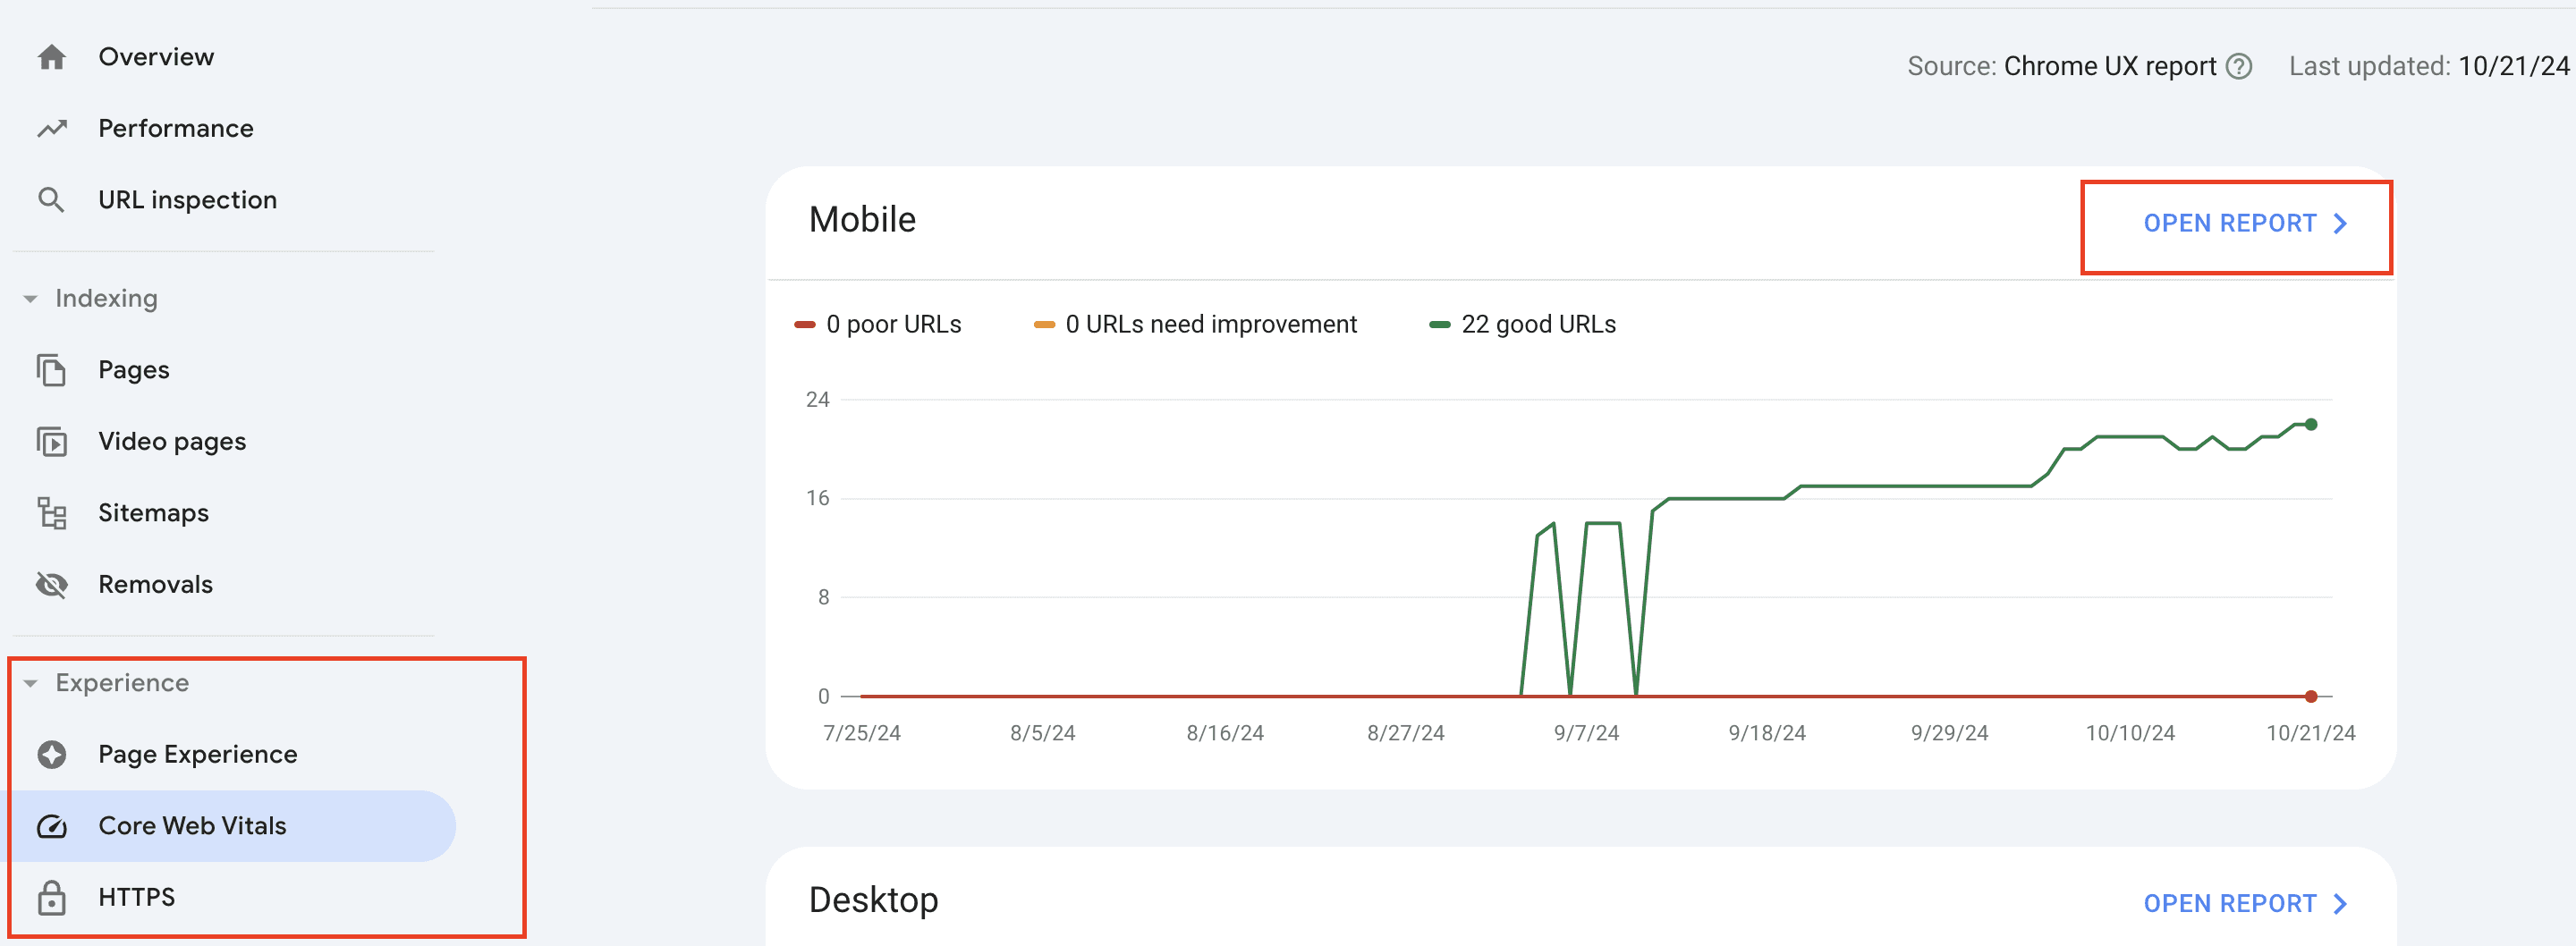
The Core Web Vitals report in Google Search Console gives you a snapshot of real user experiences, grouping pages with similar issues so you can address them more efficiently.
Just log in, select "Core Web Vitals" in the menu, and view an overview of URLs as “Poor,” “Needs Improvement,” or “Good” for both mobile and desktop.
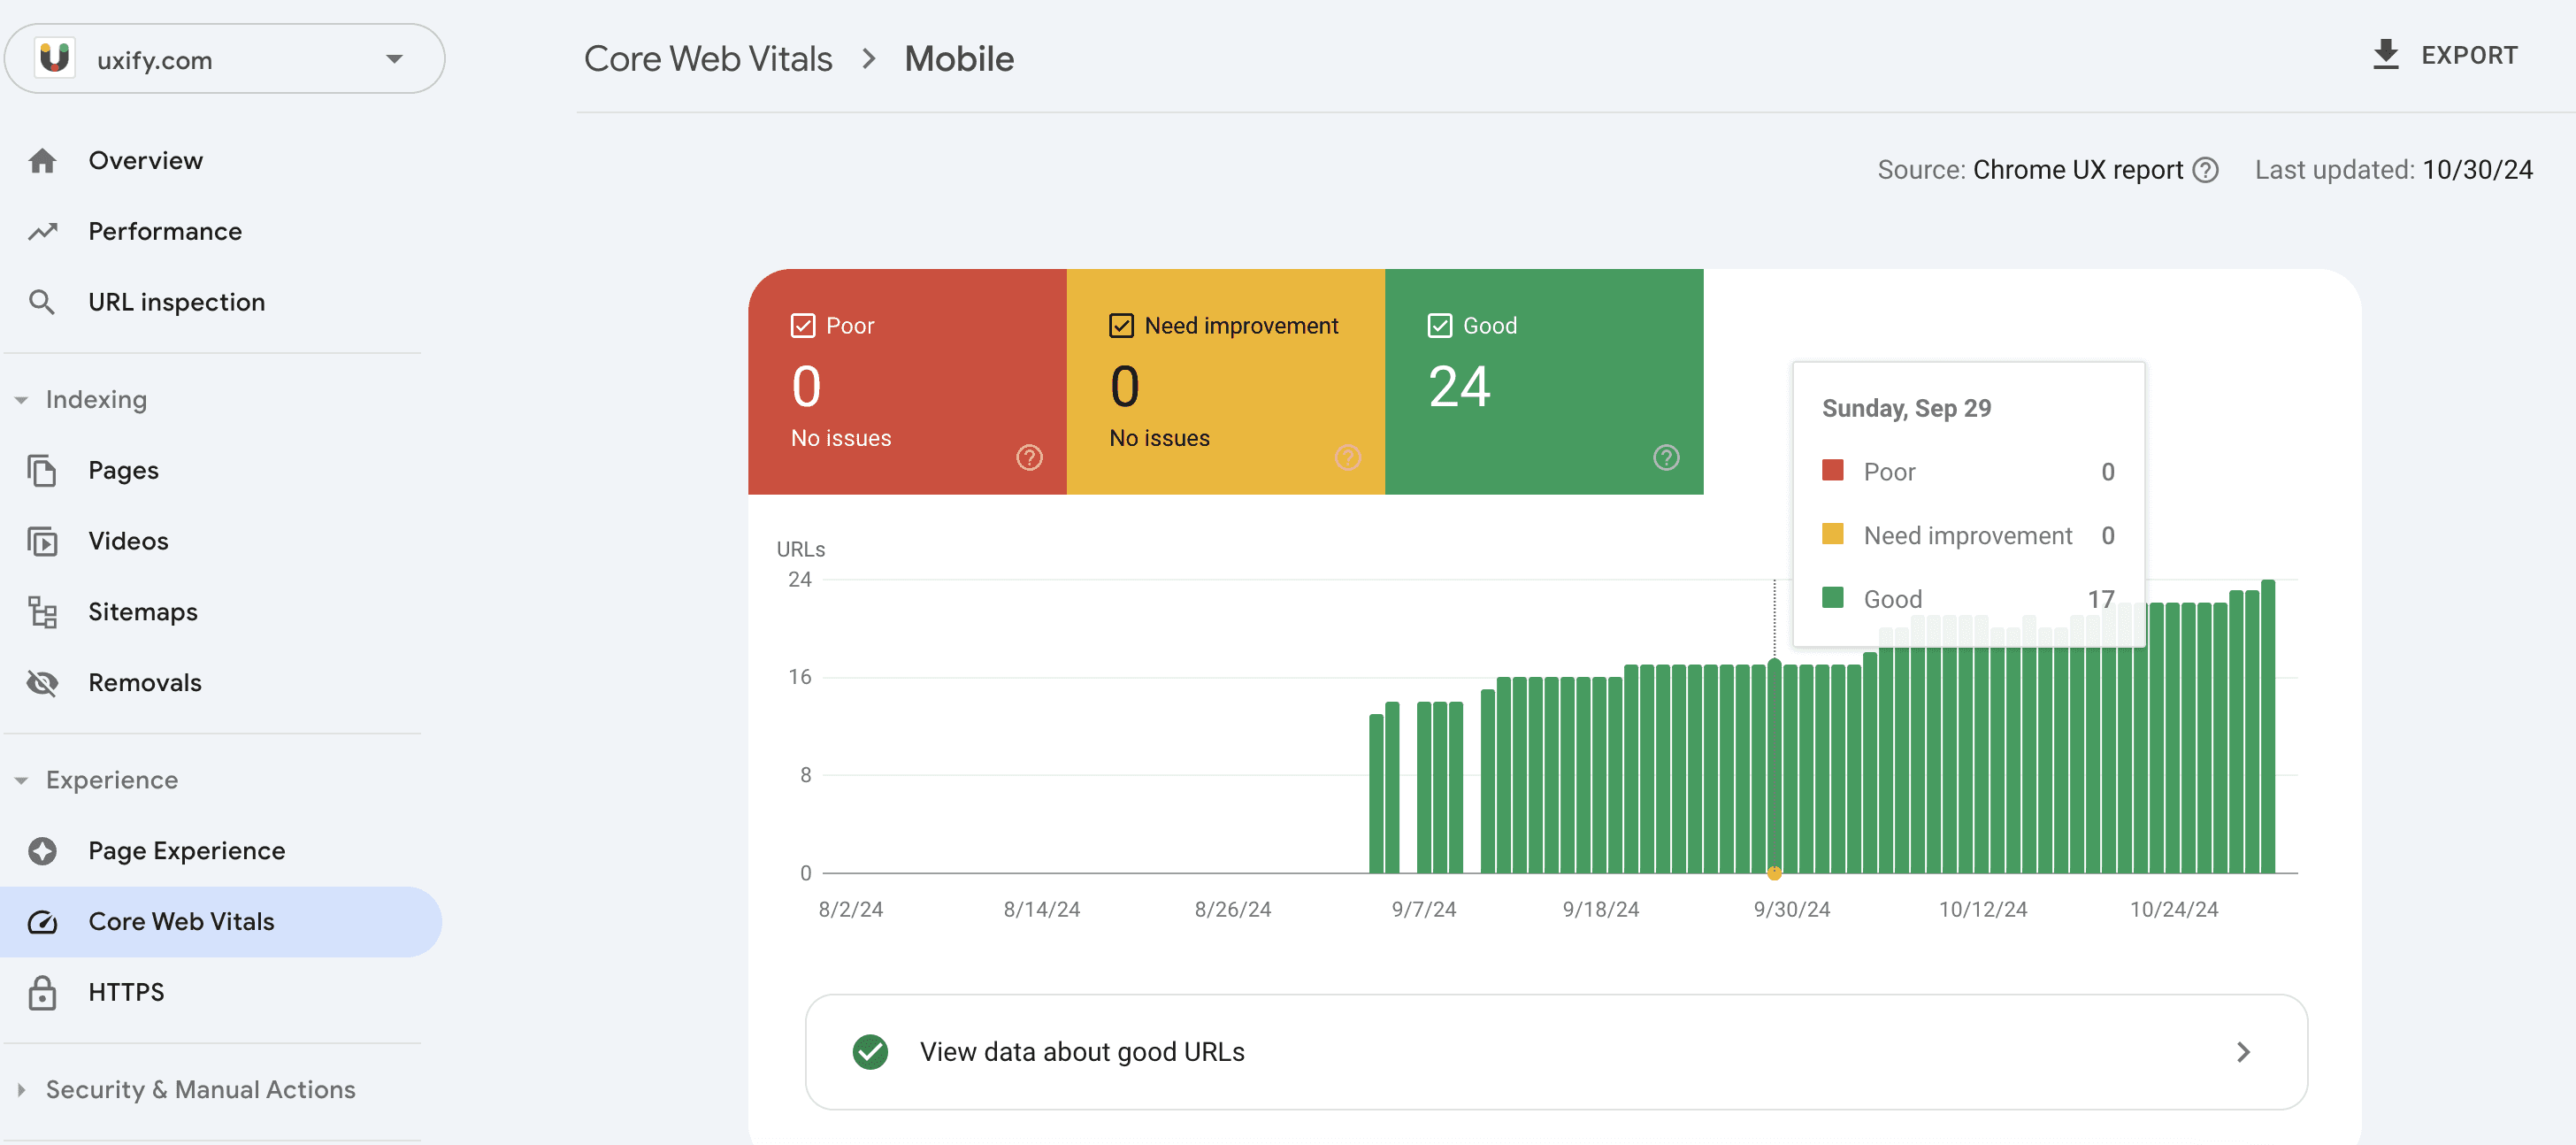
It’s perfect for understanding your site’s overall health and identifying trends rather than analyzing single pages.
Below the chart, you can see Why URLs aren't considered good section highlights which of the three Core Web Vitals need improvement on your site.
For each issue, you’ll see the number of URLs affected by the same problem. For instance, if one URL has a specific performance issue, 70 other URLs might share it, making it easier to spot widespread issues across similar pages. You can still dive deeper by clicking the URL list and selecting individual pages to analyze with PageSpeed Insights.

⚠️ Google may not have enough data for every page on your site to assess its Core Web Vitals individually. To address this, URLs with similar types are grouped together — such as product pages — so they share a collective Web Vitals ranking signal.
CrUX Vis
Google has launched a powerful new tool, CrUX Vis, designed to make it easier than ever to access historical Core Web Vitals data. While historical CrUX data has been available via API, CrUX Vis now provides a user-friendly interface for viewing Core Web Vitals trends over time.
All you need to do is type-in the URL you want to test, and you’ll get a 25-week trend of your CWV scores.
⚠️ It’s worth noting that the CrUX report collects real user experience data specifically from Chrome users who have enabled usage statistics. On mobile, this data is gathered from Android devices only, not iOS. So if your site is new or has low traffic, it might not yet have enough data available to show results in CrUX Vis.
CrUX Vis offers detailed insights into your website’s performance for Core Web Vitals metrics (LCP, INP and CLS). Each metric can be analyzed over time, showing whether your site’s performance is improving or declining.
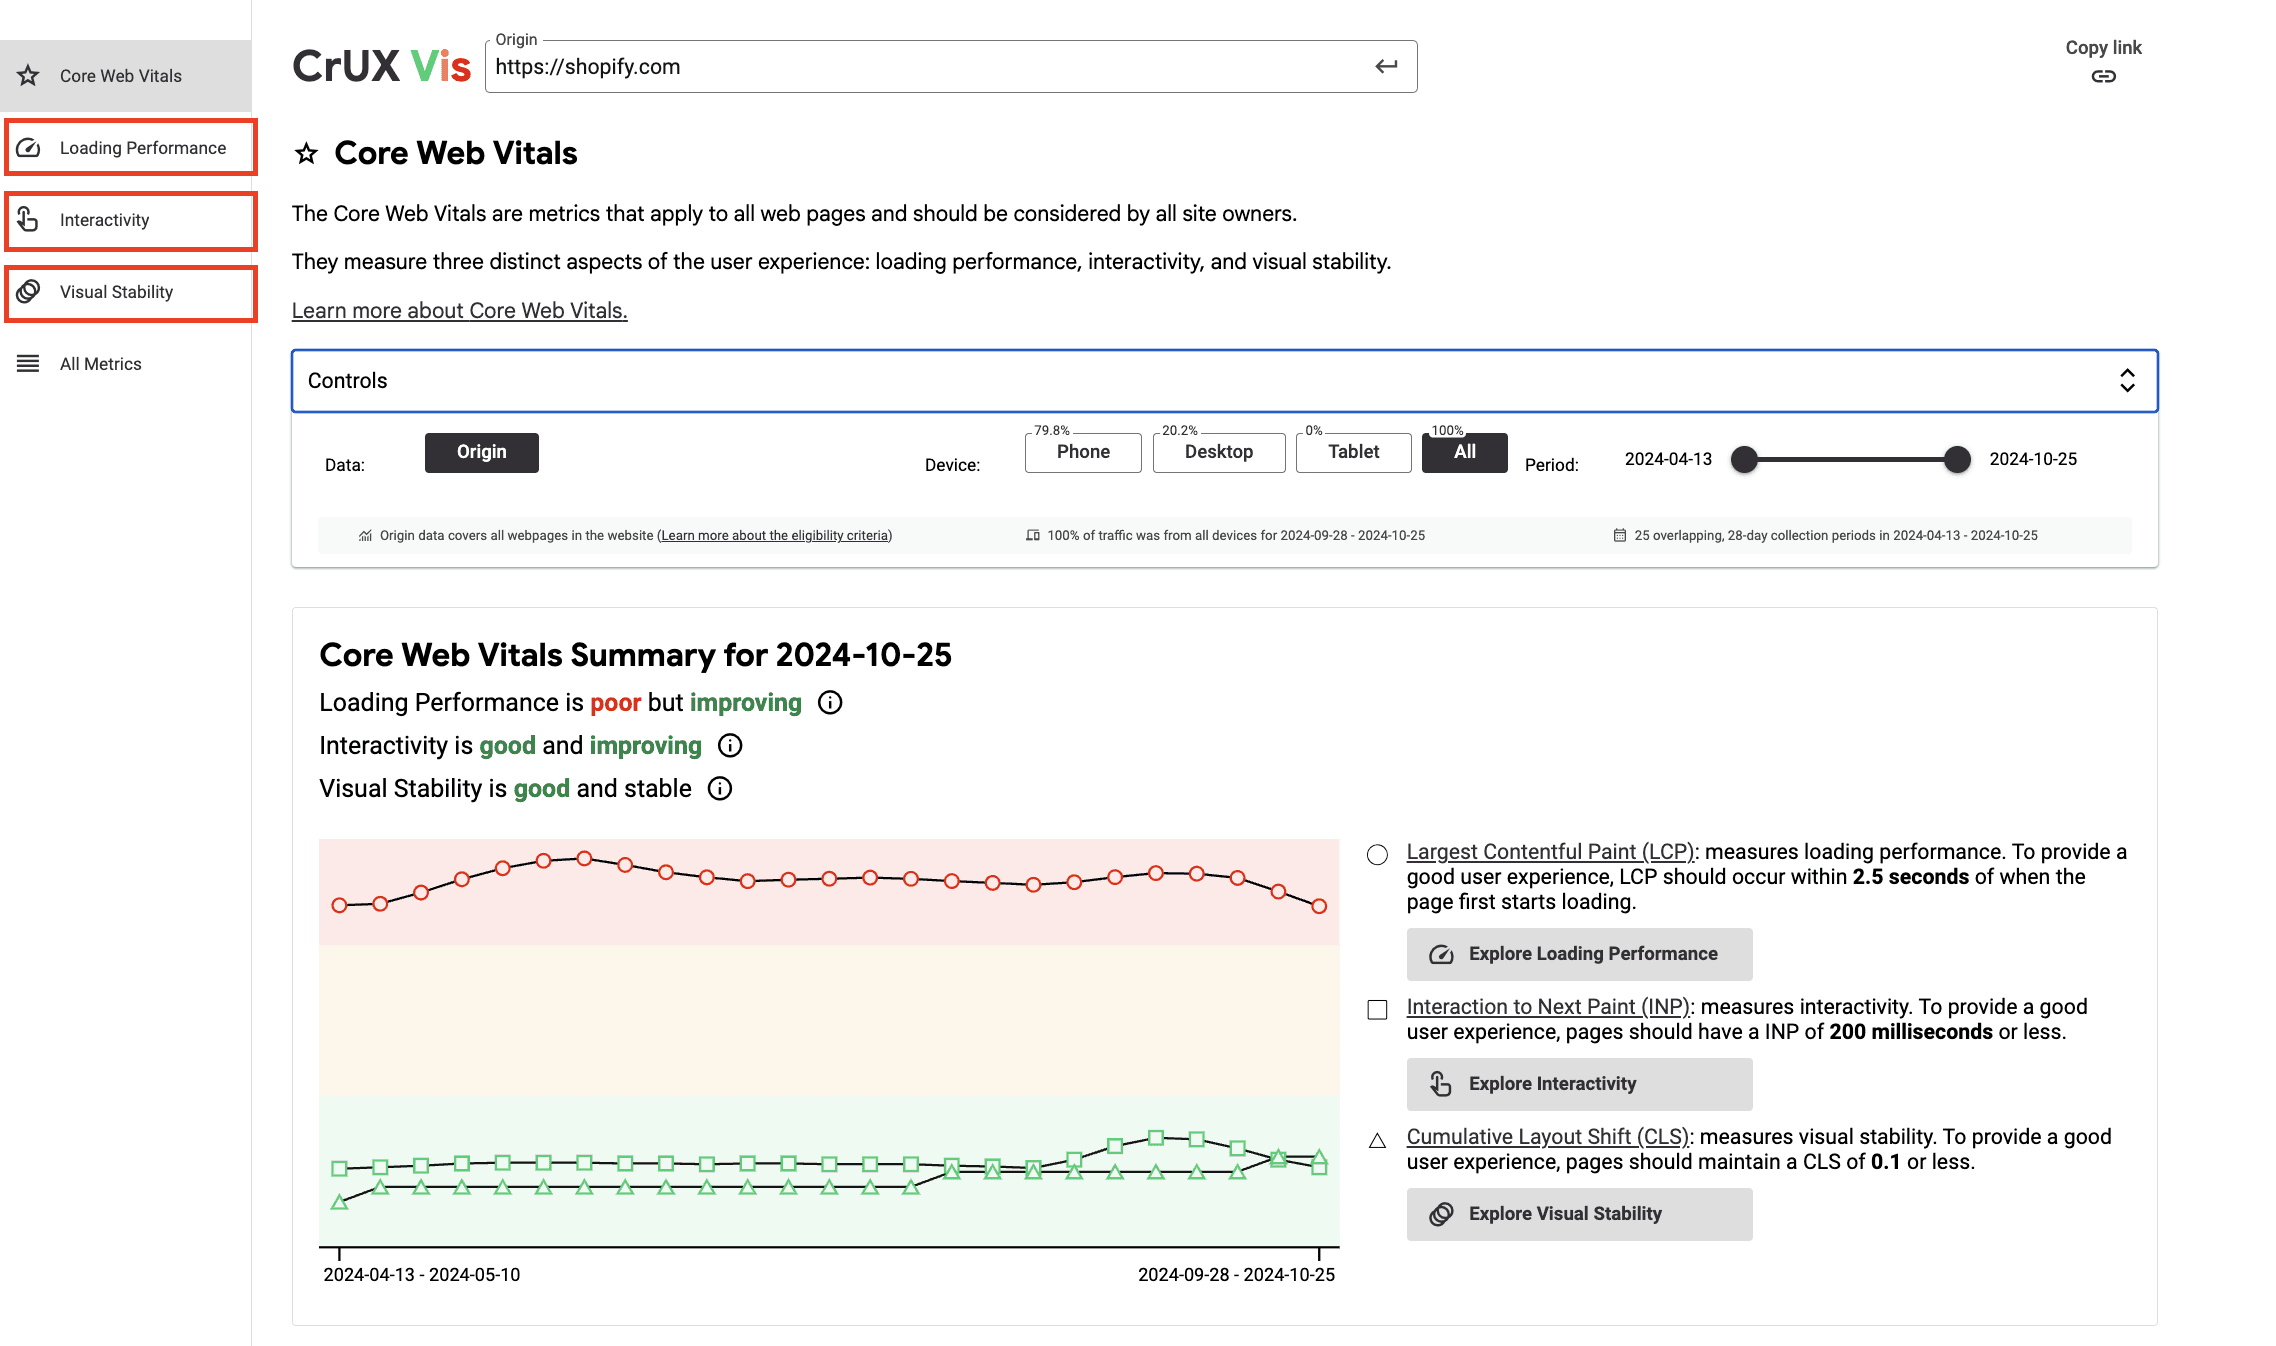
You can dive into more detailed views on each metric, including distributions of experiences rated as Good, Needs Improvement, or Poor.
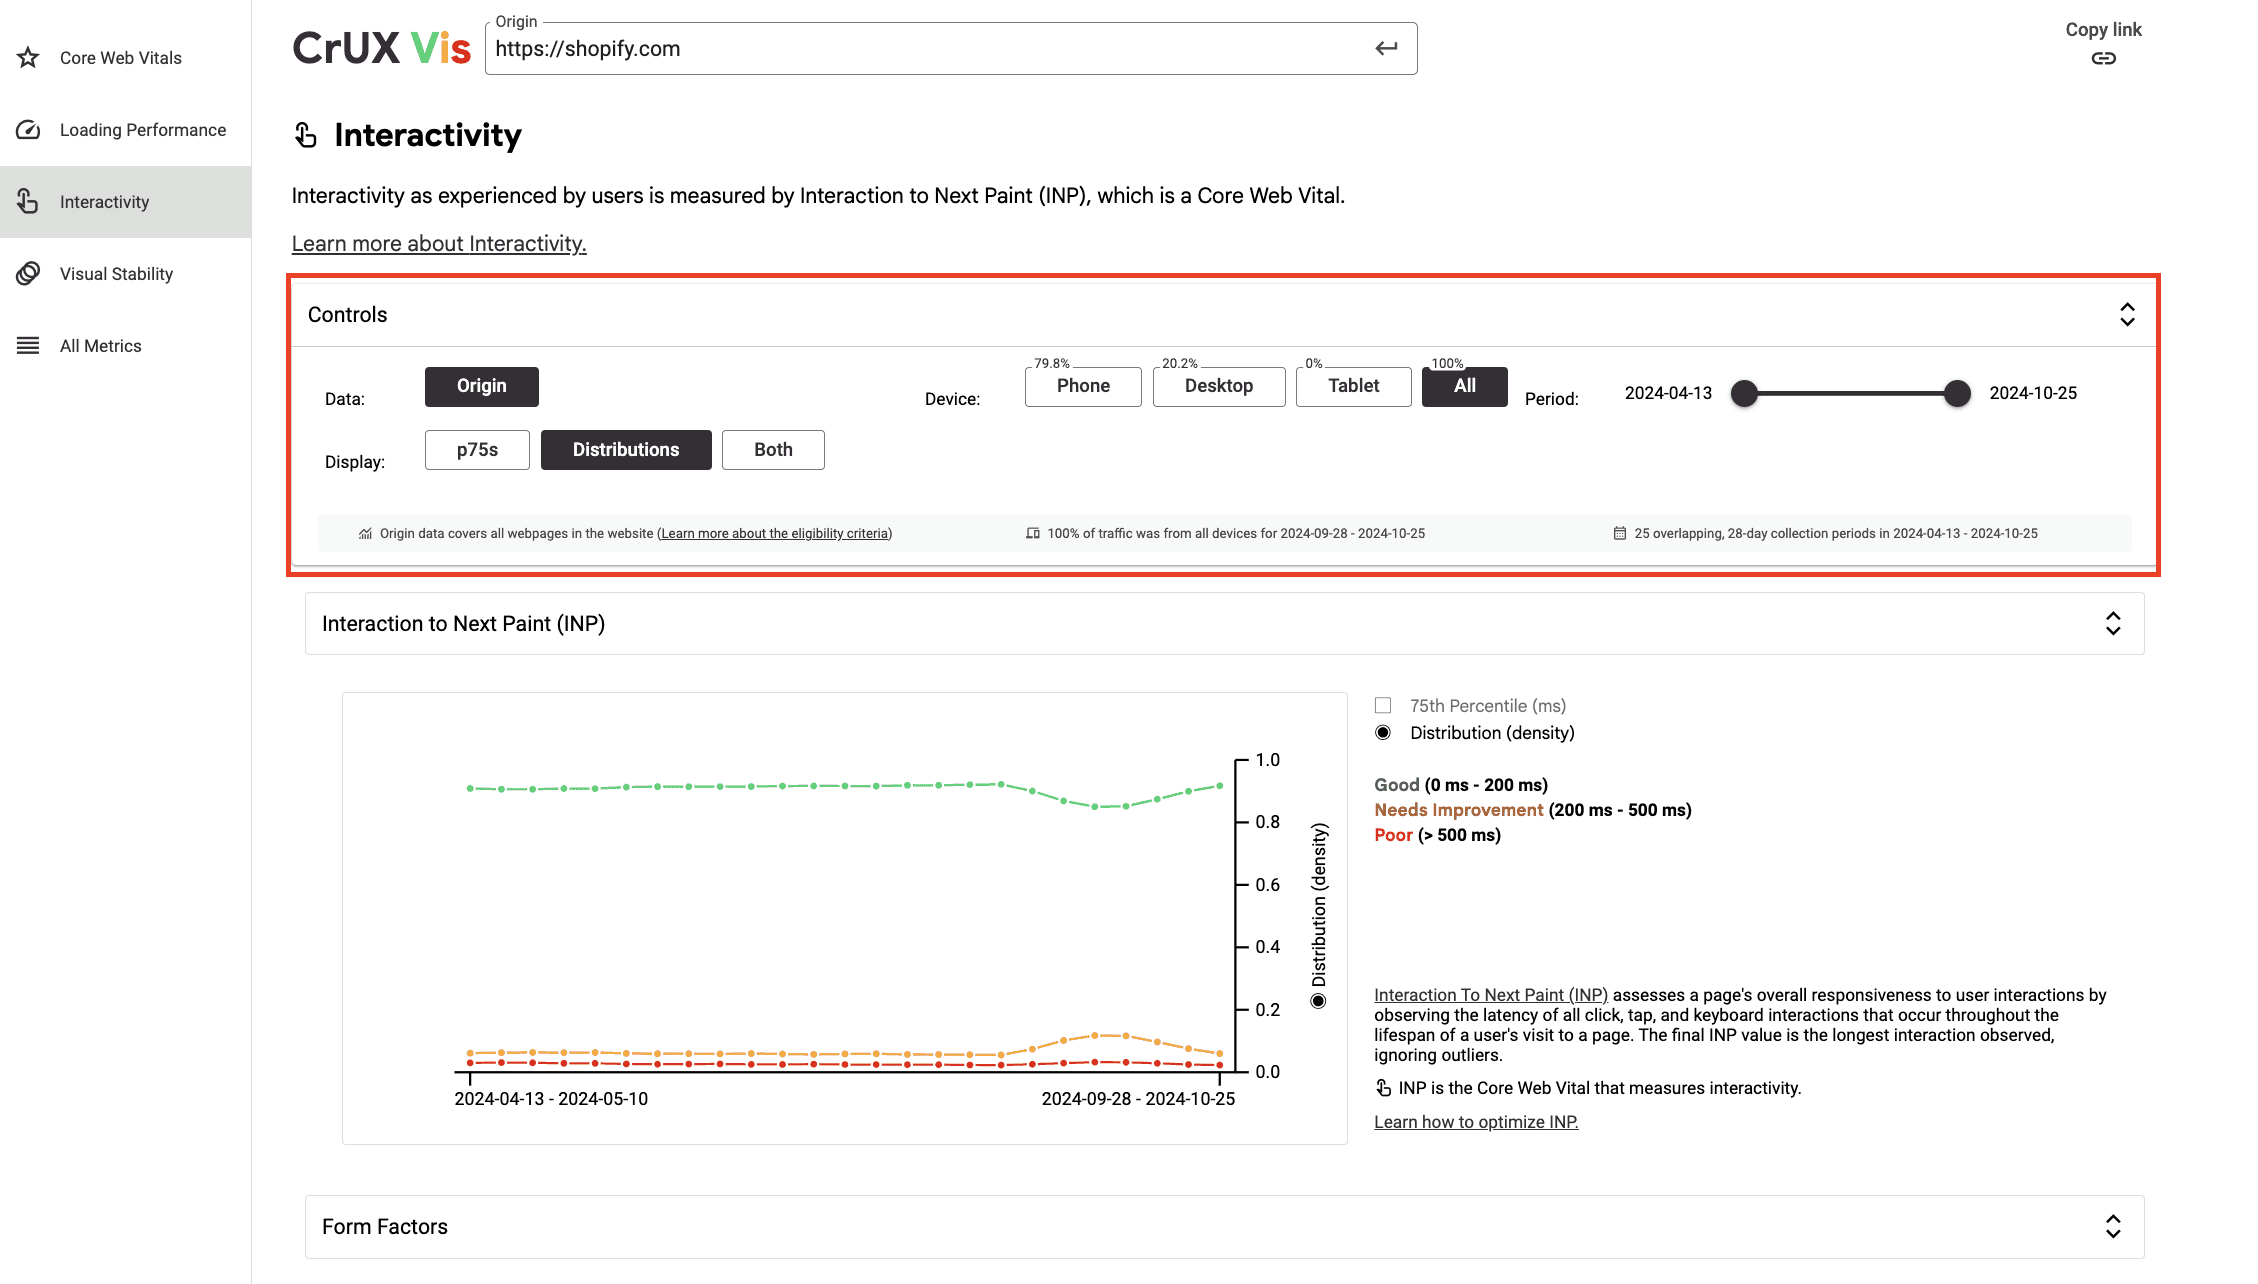
Note: The Controls section at the top of the report allows you to choose the time period and device type for the Core Web Vitals scores shown below, helping you tailor the data view to specific needs. You can also choose to plot the distribution of experiences or the 75th percentile for better understanding of the real-world usage of your site.
Lastly, in the section All Metrics, you can find performance stats for additional metrics such as First Contentful Paint (FCP) and Time to First Byte (TTFB), which provide further context for optimizing load times and server response.
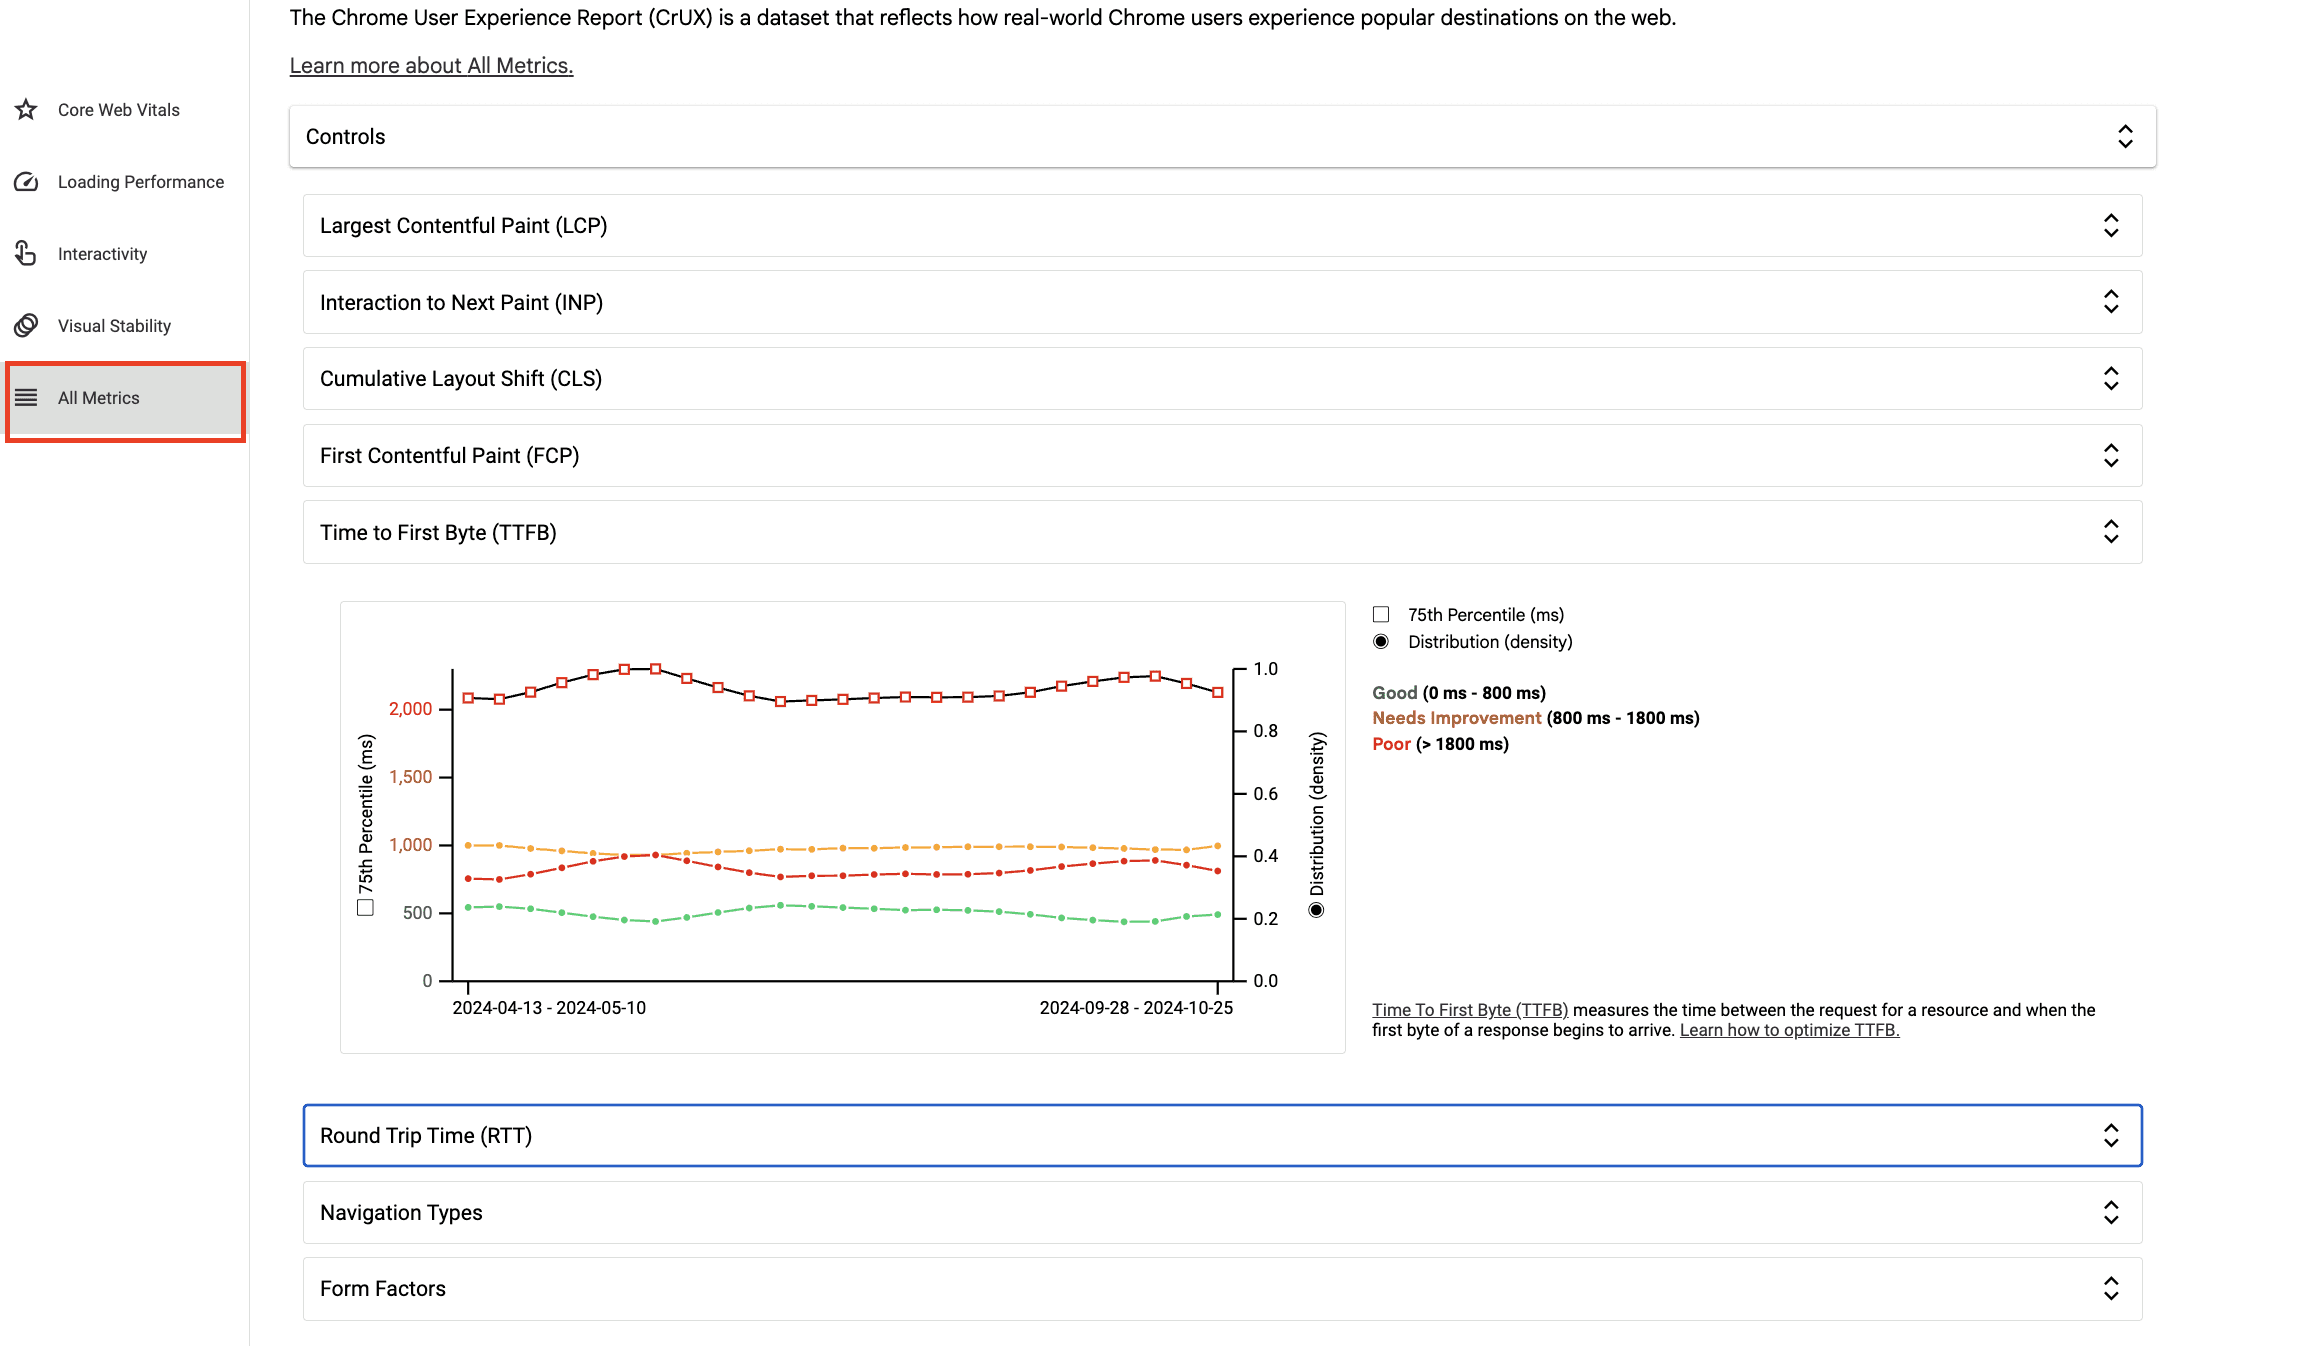
CrUX Vis makes tracking Core Web Vitals over time easy, empowering site owners to make data-driven improvements and stay competitive in 2025’s fast-paced digital landscape.
Real User Monitoring tools
Real User Monitoring (RUM) tools gather data from actual user interactions on your website, giving you insights into the loading experience in real-world scenarios. This data is crucial for monitoring Core Web Vitals, helping you pinpoint areas that need optimization.
Google Analytics
Tracking Core Web Vitals in Google Analytics is a game-changer for understanding user experience. Start by enabling the "Enhanced Measurement" feature and use GA4 and BigQuery to measure and debug performance with real-user data collected in the field.
Once activated, dive into the "Site Speed" and "Core Web Vitals" sections of your dashboard. The real magic lies in how this data informs your strategies—helping you make targeted improvements that boost user satisfaction and engagement.
WebPageTest
WebPageTest is an open-source tool that provides robust RUM capabilities. It collects performance data from real users and generates detailed reports, including waterfall charts, filmstrips, and Core Web Vitals metrics. This information helps you understand user experience metrics in-depth and spot areas that could be improved.
Using these RUM tools gives you a clearer picture of your site's Core Web Vitals in real-world use, making it easier to improve user experience effectively.
Developer favorites for analyzing performance
Chrome User Experience Report
The Chrome User Experience Report (CrUX) aggregates real user data from millions of websites, giving deep insights into Core Web Vitals based on how actual visitors interact with pages. You can dive into CrUX using:
The Chrome UX Report API (JavaScript & JSON skills needed)
BigQuery (requires Google Cloud & SQL skills)
In October 2024, Google introduced CrUX Vis (discussed above), a user-friendly tool that enables non-developers to access and visualize data from the Chrome User Experience Report (CrUX). This tool simplifies the process of understanding website performance metrics, making it more accessible to a broader audience.
Chrome DevTools Performance Tab
The Performance tab in Chrome DevTools is your go-to tool for real-time website analysis. Start by opening your site, selecting “Inspect” and navigating to “Performance.”
And voila, with just a few clicks, you get a quick snapshot of your real-time Core Web Vitals.
Note: This feature was introduced in September 2024 as part of Google’s ongoing effort to phase out the current Core Web Vitals Chrome extension —so we’ve opted not to include further details on the extension here.
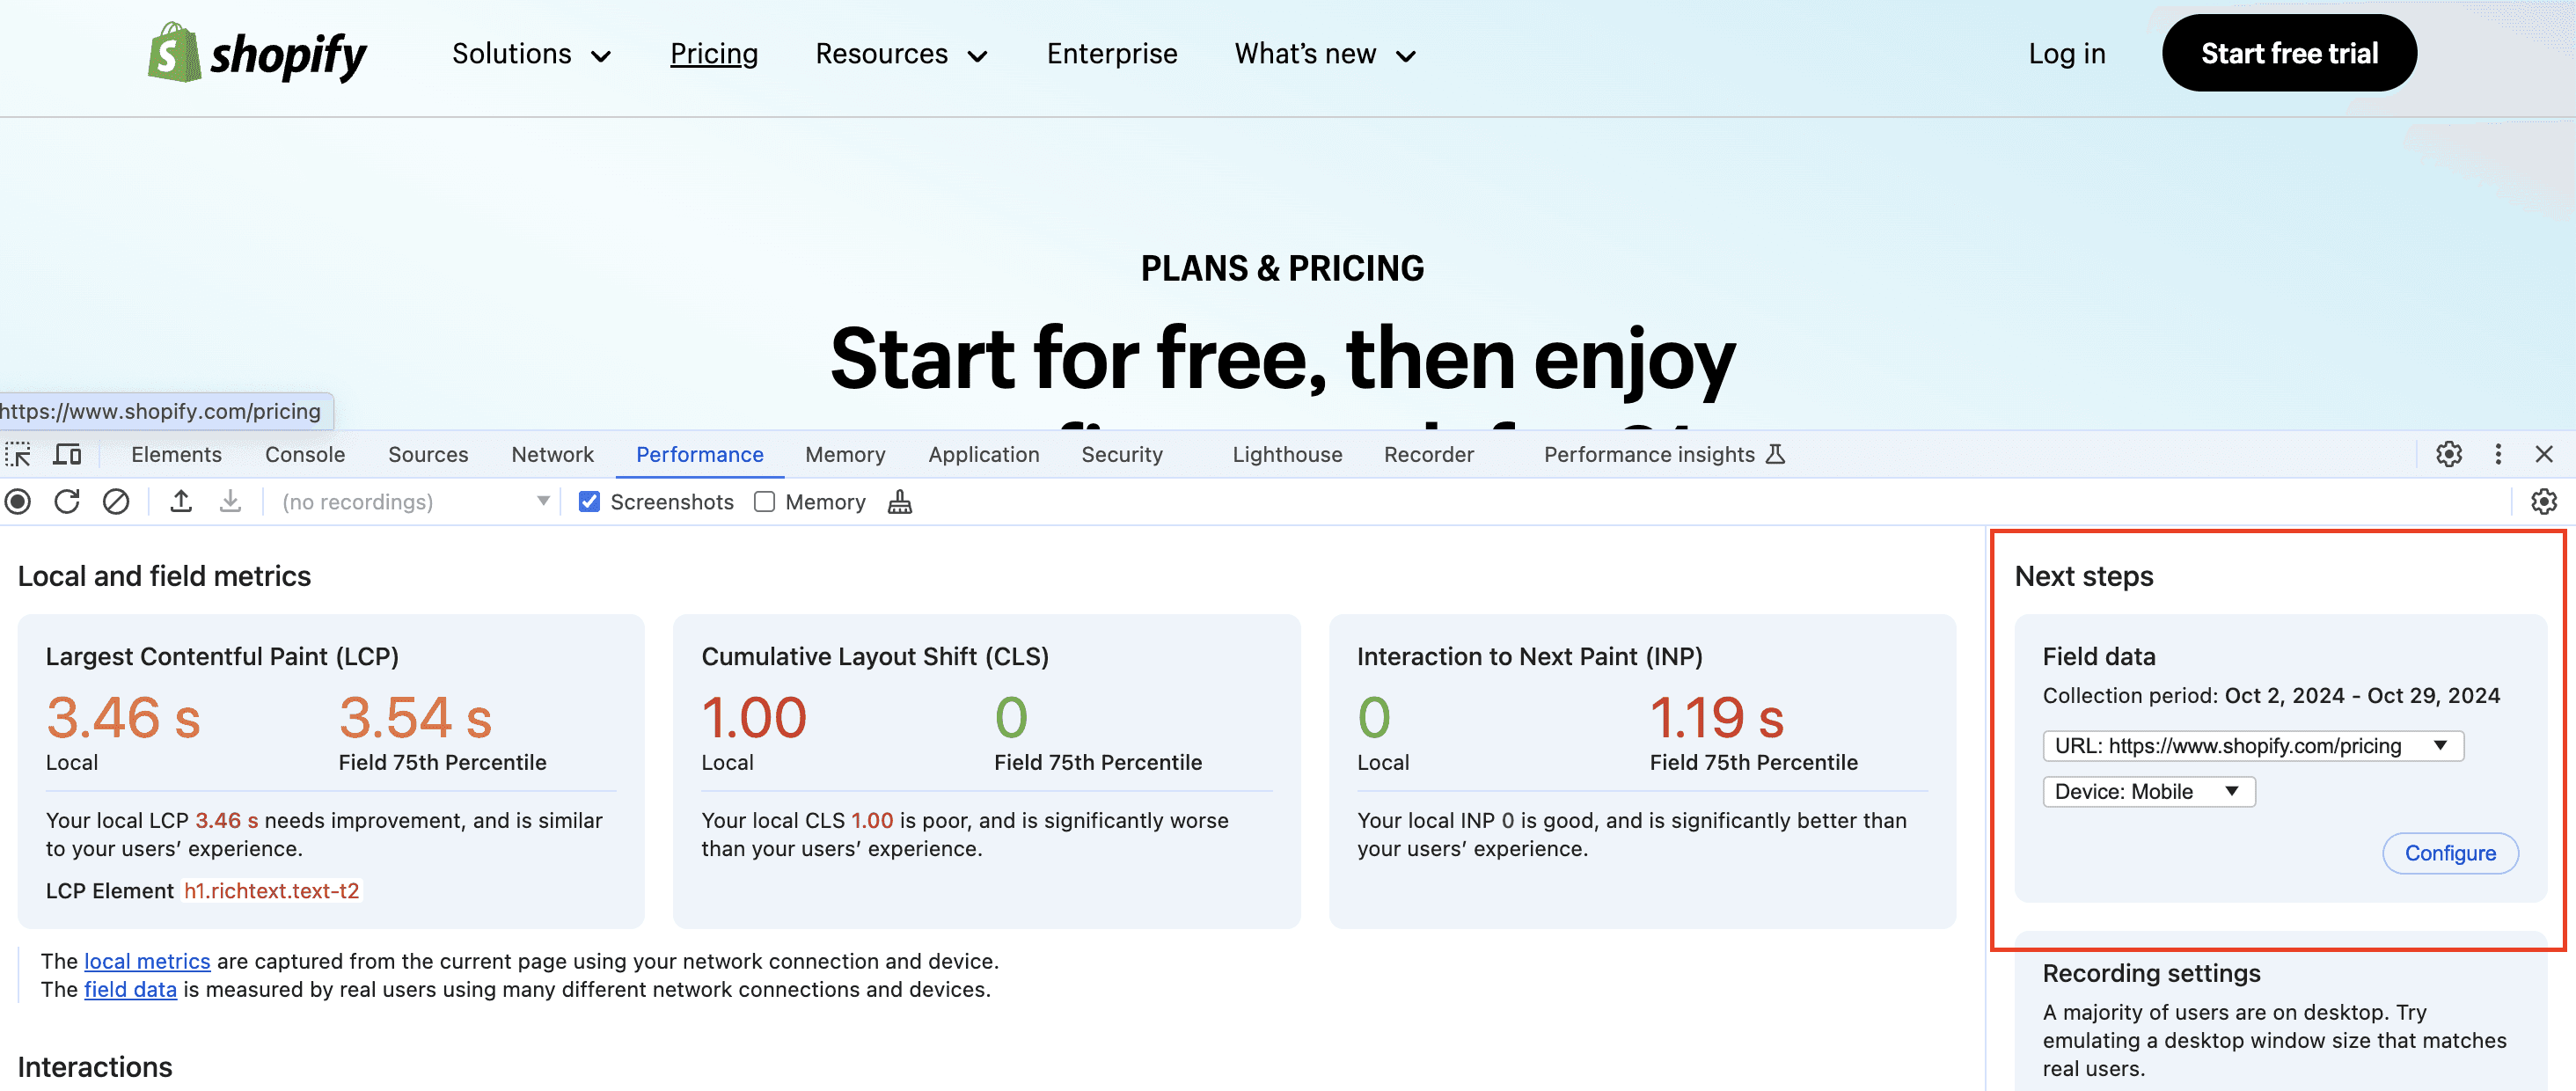
To compare your local performance data with real-world user insights from CrUX, use the Field Data section to enable the comparison. This gives you valuable data on how your optimizations impact the user experience, assisting in CWV debugging and reproducing real-user issues.
For deeper insights, hit “Record,” interact with your site, and stop the recording to review a timeline of metrics like LCP, INP, and CLS.
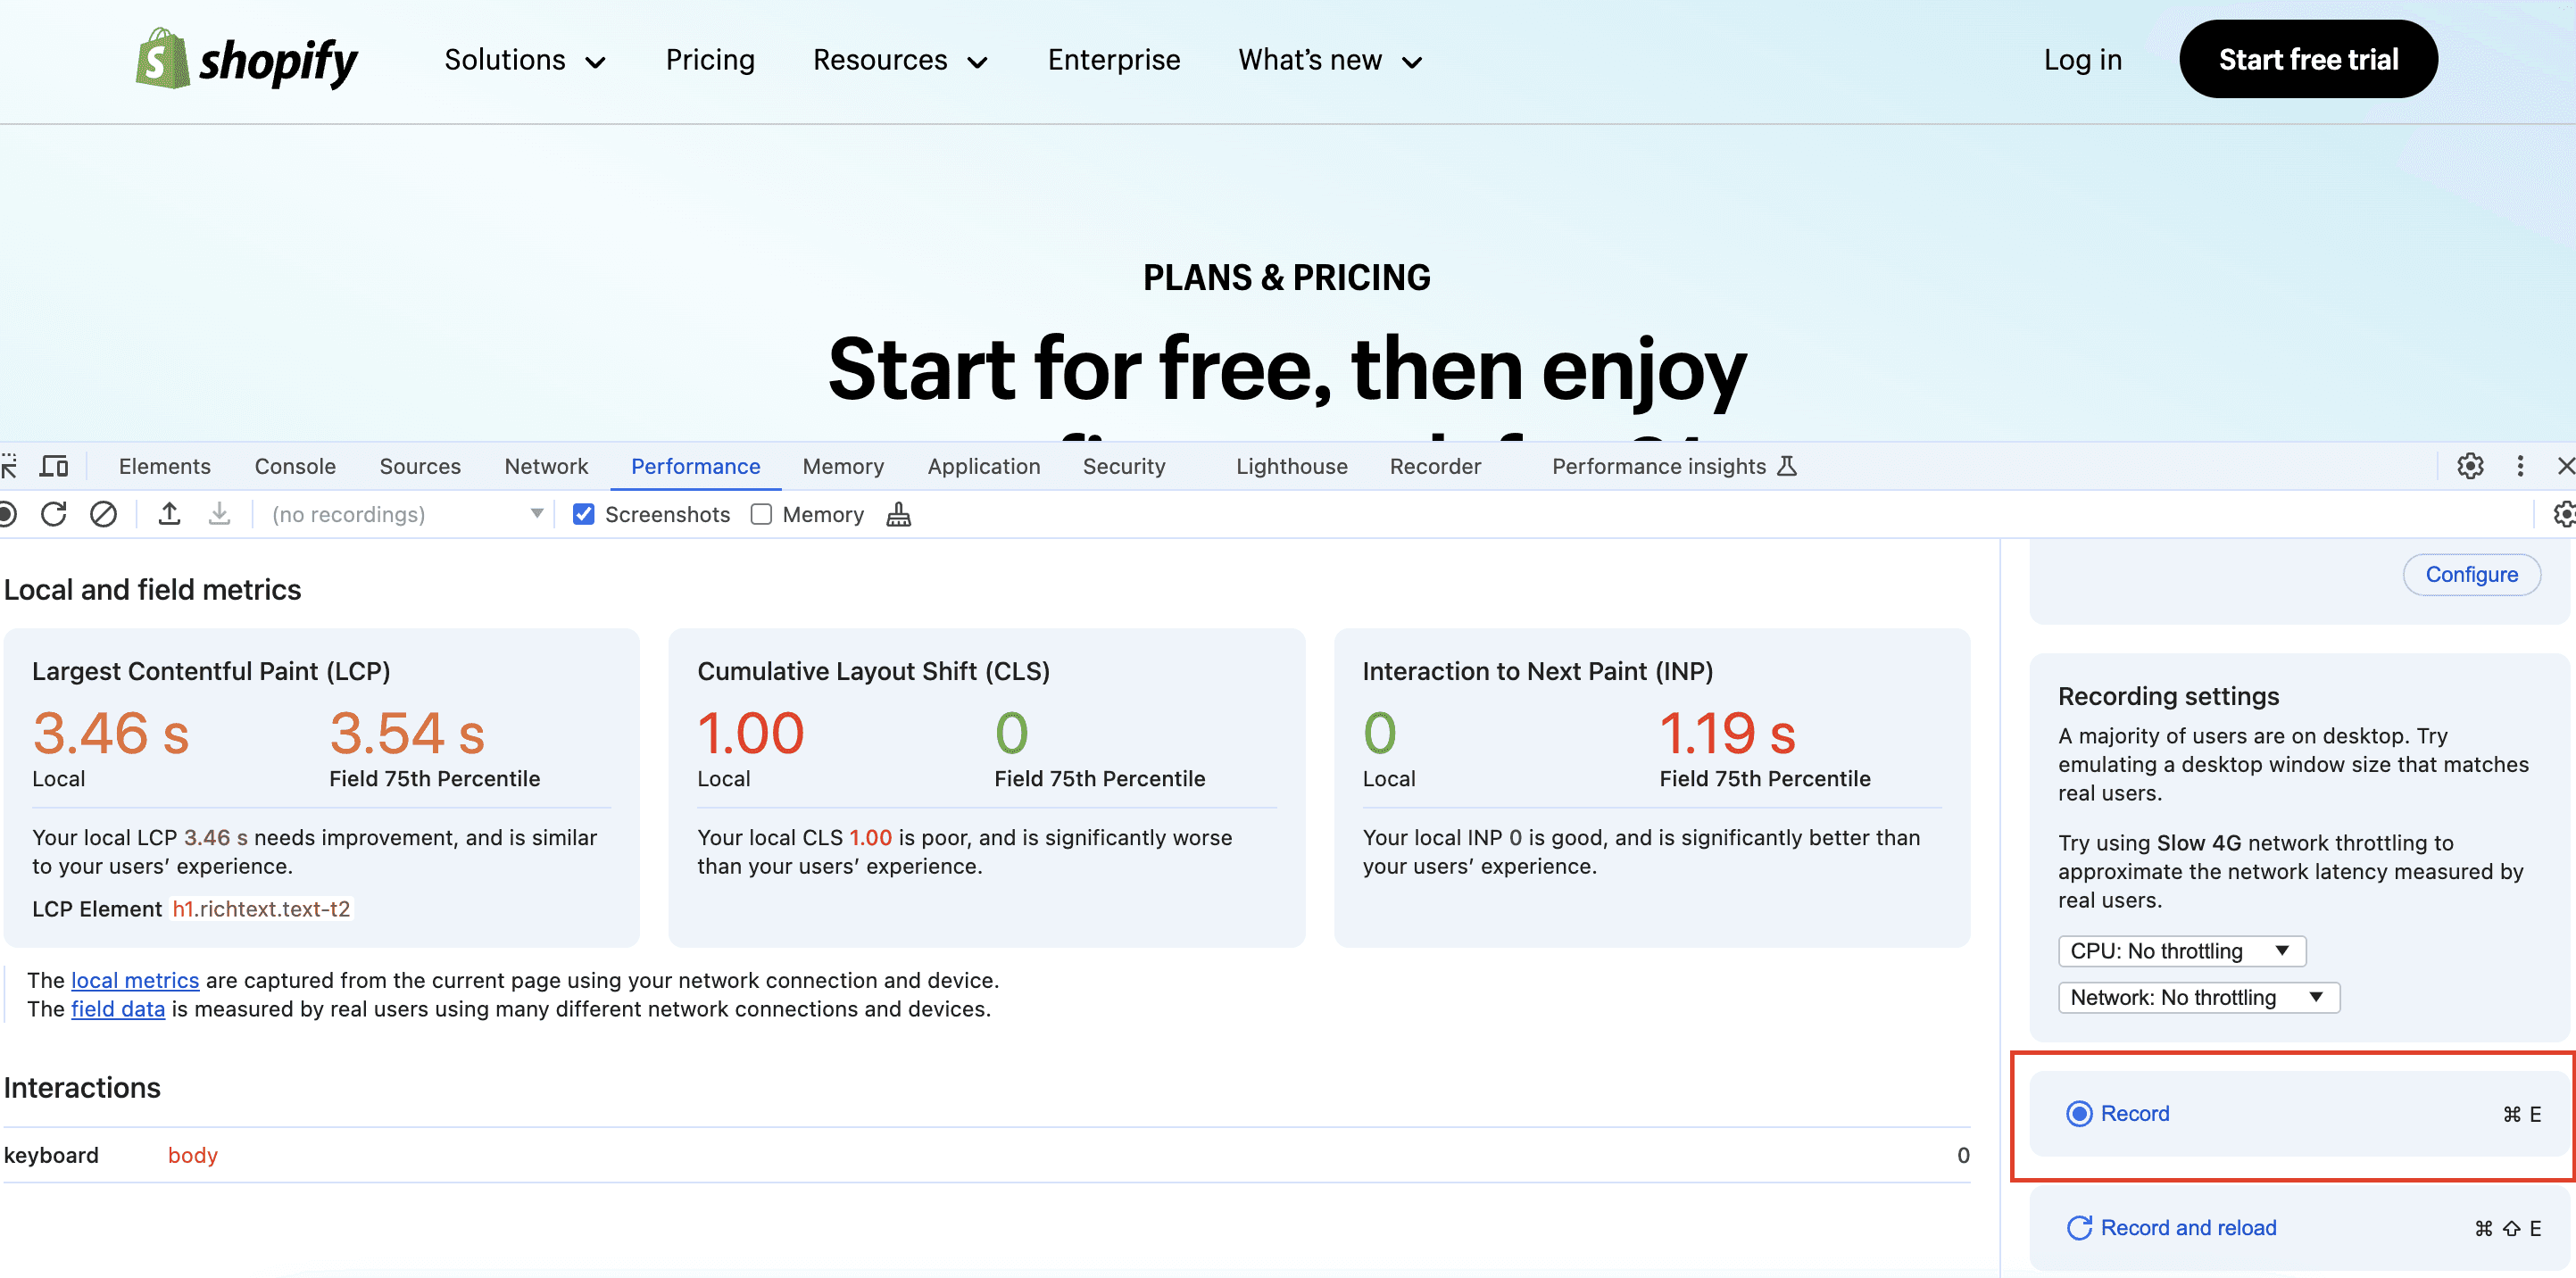
After completing your interactions, click the “Stop” button (solid square) to end the performance recording. The Performance Tab will then display a detailed timeline of the page’s activities from your session.

This powerful visualization helps you anchor your performance workflows in both real-time local data and field data from real users and allows you to gauge how much effort to put into debugging and optimizing specific metrics. By using this data, you can fine-tune your local environment to better simulate your users' devices, CPU speeds, and network conditions—making it easier to identify and address performance issues accurately.
Core Web Vitals Score: Explained
To pass Core Web Vitals, your site needs to meet Google’s benchmarks for three key metrics: Largest Contentful Paint, Interaction to Next Paint, and Cumulative Layout Shift. The goal? Hitting the 75th percentile, which means 75% of your page loads fall within target thresholds, ensuring a smooth experience for users and alignment with Google’s performance standards.
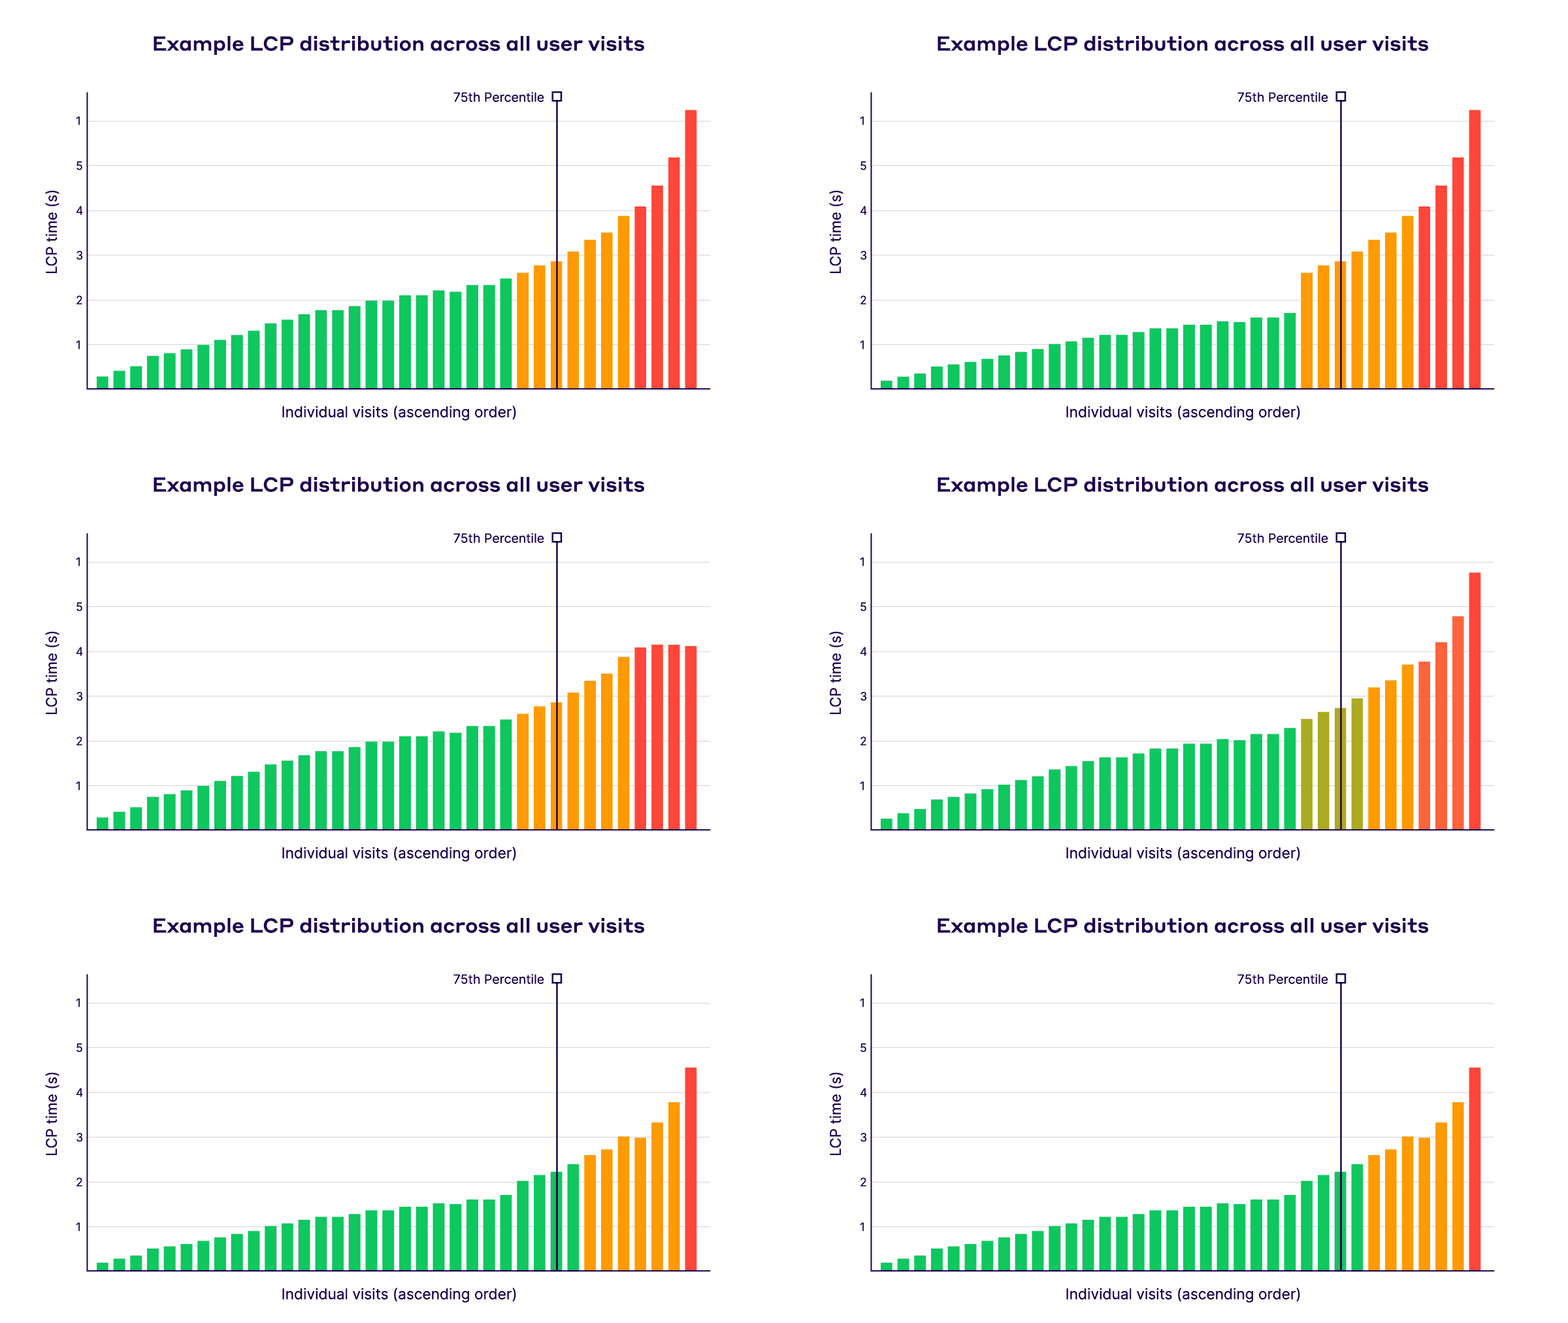
As more websites meet Core Web Vitals standards, Google may adjust the criteria to maintain a high bar for user experience. This could involve introducing new metrics or refining existing ones to better capture user interactions.
How to improve Core Web Vitals
With so many performance strategies available online, it can feel overwhelming to identify which will truly make a difference for your site.
This is partially due to the fact that there’s a lot more to consider than just the technical side of the given optimization strategy. You also need to factor in the human and organizational aspects that can impact how feasible it is to implement any given change. For example, changing fonts to fix CLS issues isn’t always feasible, as it can affect brand image and marketing positioning—making it a challenging decision for key stakeholders.
In this section of the guide, we’ll focus on optimizations techniques that deliver:
Substantial real-world benefits
Are relevant across various websites
Are feasible for most developers to implement
Whether you're new to web performance or looking for high-ROI optimizations, this is a solid starting point to maximize results.
Improve Largest Contentful Paint
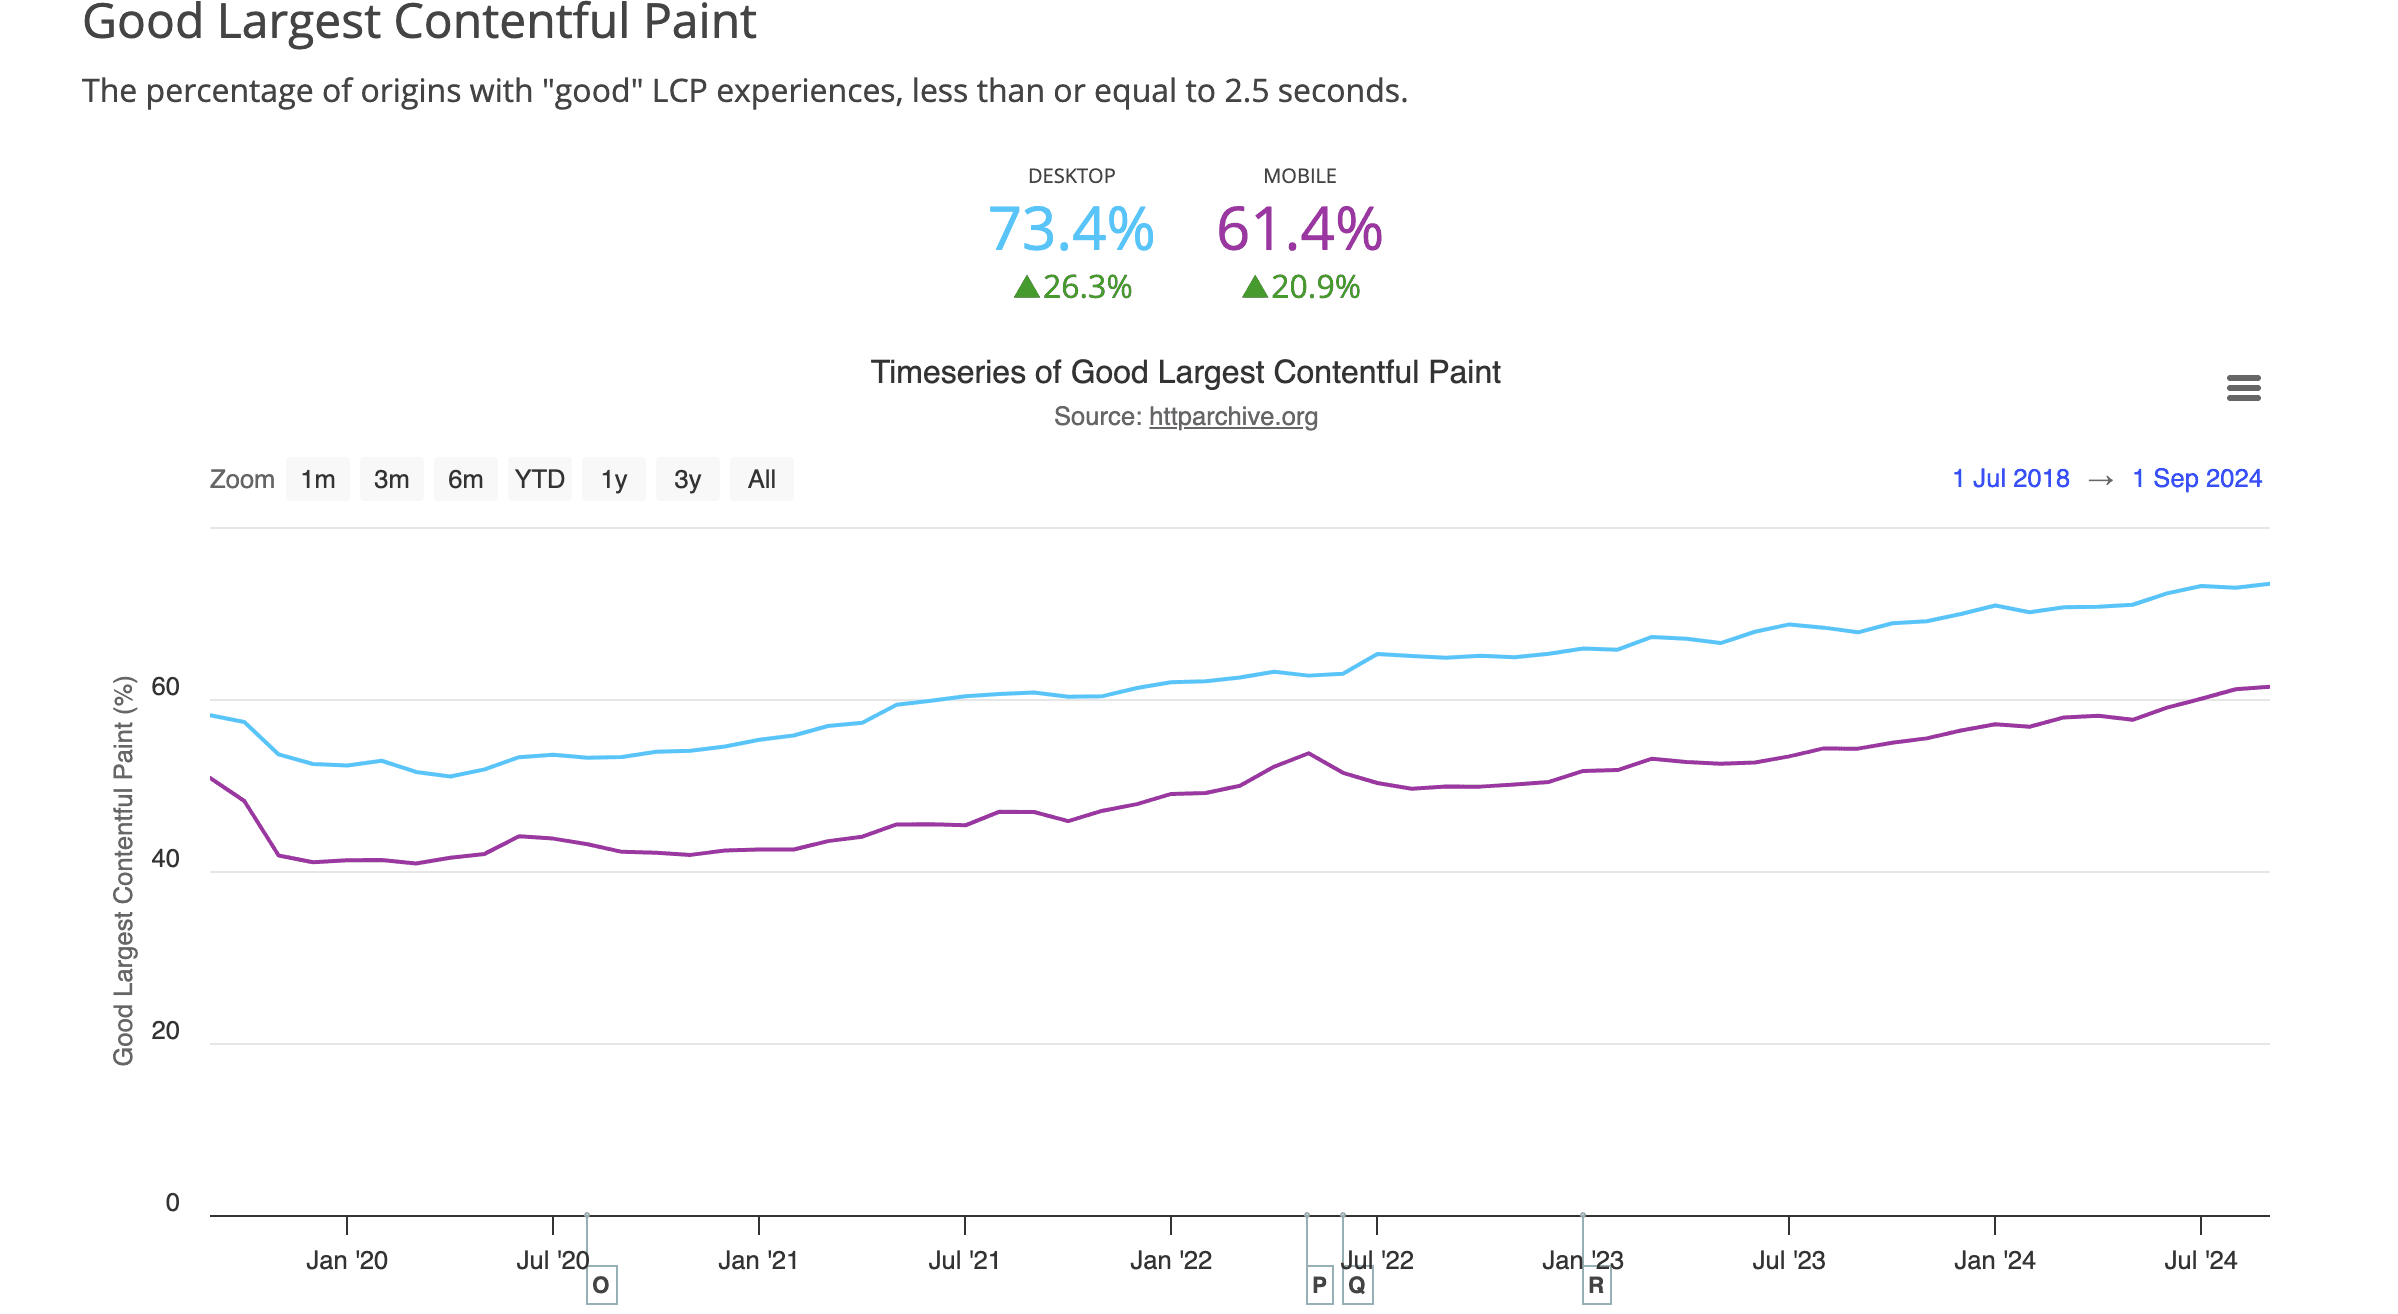
Largest Contentful Paint (LCP) is often the trickiest Core Web Vital for developers, with 40% of sites in the Chrome UX Report falling short of the recommended threshold for a great user experience on mobile.
Ensure the LCP element is easily identifiable in the HTML
Some JavaScript-based pages may load images without using an <img> tag, which can delay the LCP time since the JavaScript needs to fully load before the image appears. To speed up the process, always load images with a standard <img> tag and a src attribute. This ensures your images become visible faster, enhancing the overall loading experience for users!
Load the LCP element early and prioritize it
Identify your page’s LCP resource— we discussed how to do it using PSI — and add the fetchpriority="high" attribute to that element. This simple step ensures that your LCP loads before other less crucial HTML elements, helping to improve overall loading speed.
Also, if your image is referenced externally, include it in the HTML using a <link rel="preload"> tag, as inline styles won't allow the browser to preload effectively.
(Bonus point) Defer non-critical scripts when possible. You can achieve this by adding the async or defer attribute to your script tags. Moving these to the end of your document (using the defer attribute) or loading them asynchronously (with the async attribute) will help clear the path for the LCP resource to load quicker.
Lazy-load non-critical resources
To enhance your site's loading speed, implement lazy-loading by adding the loading="lazy" attribute to your non-LCP resources, such as images, iframes, and smaller JavaScript files. This ensures that these elements load after your LCP resource, improving the initial loading time and overall user experience. This approach allows for quicker access to important content, as non-essential resources won't hinder the page's performance.
⚠️ Do not lazy load the LCP element!
Remove loading="lazy" from the LCP image to prevent delays in loading.
Optimize your images
Images are a significant factor in page load times, making optimization crucial for site owners. Begin by resizing and compressing images and adopting efficient formats like WebP or AVIF for better compression without quality loss. Tools like TinyIMG or Imagify can help you with automatically implementing these techniques for your visuals.
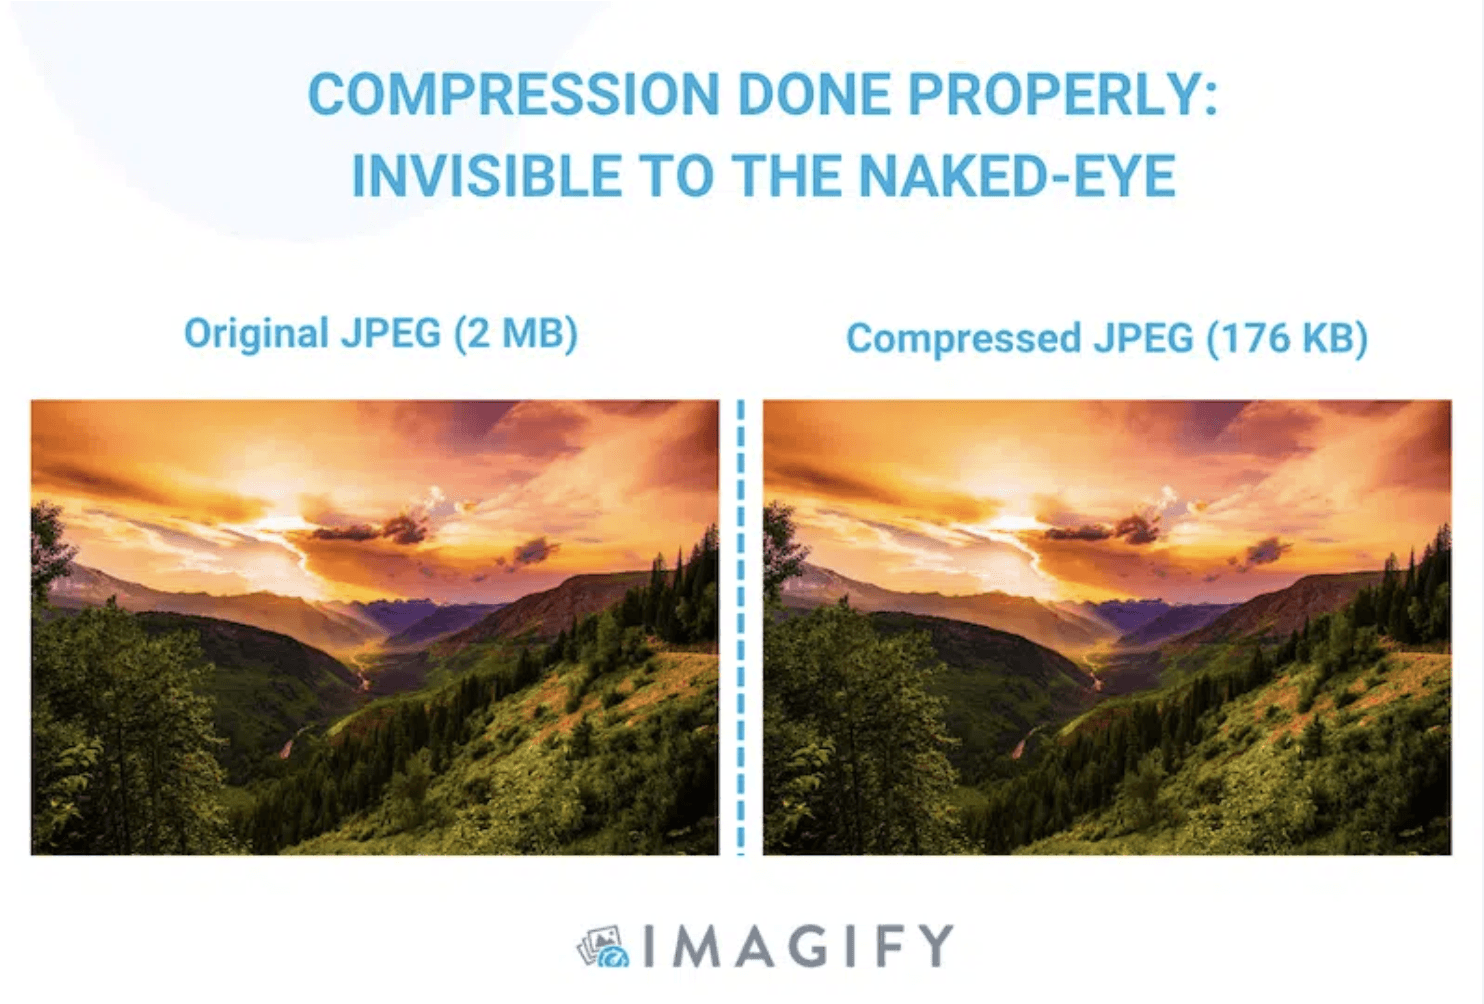
Source: Imagify
Improve Time to First Byte
To enhance Time to First Byte (TTFB), ensure your content is served close to users and utilize caching for quick access.
A Content Delivery Network (CDN) is an effective solution to distribute resources to edge servers globally, minimizing travel time for data.
(Advanced tip) You can enable CDN edge caching and store static HTML versions of your pages for even better results.
And on the topic of TTFB, it's essential to highlight the importance of two key factors:
Fast Hosting: Choosing a high-performance hosting provider can significantly reduce server response times, ensuring that data reaches users quickly.
Effective Caching Policy: Implementing a solid caching strategy allows frequently accessed content to be served swiftly from the cache, minimizing load times for returning visitors.
By improving these aspects alongside using a CDN, you can optimize the overall website performance.
Improve Interaction to Next Paint
As the latest addition to Core Web Vitals, Interaction to Next Paint some sites might still be adjusting to this metric. To get started, focus on key techniques that effectively boost INP and ensure a better user experience.
Break up long tasks
Long tasks in a web browser, like rendering or executing scripts, can slow down user interactions if they take too long—over 50 milliseconds.
To keep your website responsive, it's essential to break up long-running tasks into smaller, manageable chunks. This prevents the main thread from getting blocked, ensuring that the browser remains responsive and provides a smoother visual experience during user interactions. Incorporating this practice allows users to interact with your site more fluidly, without experiencing frustrating delays.
Using the Scheduler API, you can queue work in a way that allows the browser to handle user actions more smoothly. By yielding to the main thread frequently, you give the browser a chance to update the display and respond to clicks or taps faster, enhancing the overall user experience.
Alongside manual fixes like breaking up long tasks and reducing JavaScript, automated optimization can also help. Uxify’s INProve detects moments when heavy scripts would block user interactions and smartly reschedules that work, helping clicks and taps go through faster.
Limit the JavaScript on a page
Today, many websites are overloaded with JavaScript, which can slow things down. But don’t worry; there are simple ways to tackle this!
Use Built-in Features: To avoid using too much JavaScript, use the browser's built-in features instead of adding extra code. Many things, like animations and form validation, work well without extra JavaScript, keeping your site faster and simpler.
Clean Up Your Code: Use Chrome’s coverage tool to find and remove unused code, making your site lighter and faster.
Split Your Code: Break up your scripts so only the essentials load at first, and save the rest for later.
Optimize Tags: If you use a tag manager, regularly tidy up any old tags that aren’t being used.
Avoid large rendering updates
Rendering updates can slow down how quickly your website responds to user actions. To keep your site snappy, consider these strategies:
Organize Your Code: Structure your JavaScript to minimize layout shifts by separating DOM reads and writes.
Limit DOM Size: A smaller DOM means less work for the browser when recalculating layouts, making everything faster. Aim to keep your DOM size under 1,400 nodes to enhance performance. You can achieve this by avoiding bloated HTML, minimizing JavaScript-based DOM manipulation, and steering clear of heavy page builders or plugins that can inflate your DOM. A leaner DOM leads to faster rendering and better responsiveness, ensuring users enjoy a smoother browsing experience.
Use CSS Containment: This helps manage off-screen content, reducing unnecessary rendering tasks and keeps your site responsive.
Immediate user feedback
Optimizing INP isn’t just about making interactions instant—sometimes, that’s not achievable. Giving users feedback on their actions is key—even if the page is still loading. A simple spinner or progress indicator when content is loading reassures users that their click has been received and things are happening behind the scenes.
This approach enhances the perceived speed of your site, making it feel more responsive and reducing user frustration during longer tasks. Implementing feedback cues where needed keeps users engaged and satisfied, improving their overall experience on your site.
Improve Cumulative Layout Shift
Cumulative Layout Shift gauges a web page's visual stability, indicating how much content shifts unexpectedly during loading. About 25% of websites fall short of the recommended threshold, so fixing CLS issues presents a significant opportunity for improvement.
Set explicit sizes for loaded content
One of the best ways to prevent shifts caused by images is to clearly define their width and height. Surprisingly, around 72% of pages have at least one image that isn’t sized, which can cause unexpected movement when it loads. This is an easy fix that can greatly enhance your site’s stability!
Additionally, if you’re running ads on your site through solutions like AdSense, defining the area where each ad will load is essential. By setting fixed container sizes for ads using the aspect-ratio property , you prevent disruptive layout shifts, which improves user experience by keeping content stable and predictable. This approach doesn’t just enhance Core Web Vitals; it also positively impacts monetization. A stable layout reduces user frustration, leading to longer time-on-site and better engagement. As a result, ads achieve higher viewability and click-through rates, making placements more valuable to advertisers and potentially increasing revenue.
Avoid animations affecting the layout
When it comes to making your website visually appealing, be cautious with animations and transitions. Elements like cookie banners that slide in can cause content to shift unexpectedly, creating a frustrating experience for users. Even if these animations don’t push other content out of the way, they can still impact your site’s stability.
To keep your site looking smooth, avoid animating properties that affect layout, like margins or borders. Instead, use the CSS transform property to create animations that won’t disrupt the layout, ensuring a more pleasant browsing experience.
Make sure your pages can use back/forward cache
The back/forward cache (bfcache) is a smart feature that allows your browser to quickly load pages you've visited before, making your browsing experience smoother. It not only speeds things up but also prevents content from shifting around when a page loads.
Unfortunately, many websites can’t take advantage of this helpful tool. Make sure your pages are eligible for this feature by following these criteria:
Avoid Using “Unload” Events
The unload event can make pages ineligible for bfcache, as it disrupts how pages are stored and restored. Instead, use the pagehide event, which works reliably across browsers and allows pages to load instantly from the bfcache.
Use Permissions Policy for Better Control
To prevent any third-party code from adding unload events and disqualifying pages from bfcache, set up a Permissions Policy:
Permission-Policy: unload=()
This keeps both your code and third-party code aligned with bfcache requirements.
Be Cautious with beforeunload
The beforeunload event can alert users about unsaved changes but can reduce reliability for bfcache. To use it effectively, only trigger it when necessary (such as when users have unsaved work) and remove it once no longer needed.
Limit the Use of “no-store” in Cache-Control
Pages with sensitive content may require Cache-Control: no-store to avoid caching sensitive data, but this also makes them ineligible for bfcache. Use no-store only on critical pages where no caching is desired. For other dynamic pages, consider using Cache-Control: no-cache instead, which doesn’t prevent bfcache eligibility.
To make browsing even faster, Chrome is testing ways to use bfcache for some pages with Cache-Control: no-store—but only when it’s safe to do so. Chrome is rolling this out gradually, starting with 10% of pages and working up to 50% next year. Pages with sensitive actions (like a logout page) or certain features (like live video chats) won’t be eligible for this fast-loading feature.
Update Stale Data After bfcache Restore
To keep data accurate, add an update for important information (like cart details or user info) whenever a page is restored from bfcache. Use the pageshow event to check if data needs refreshing:
window.addEventListener('pageshow', (event) => {
  if (event.persisted) {
    // Update the page data here
  }
});
Refresh Ads Without Reloading the Page
If you serve ads, you may want to refresh them without impacting page performance. When a page is restored from bfcache, use the example above to detect bfcache restoration and reload only the ads.
Avoid Open Connections on Page Leave
To be eligible for bfcache, close any ongoing connections (e.g., WebSockets) or API access when users leave the page. Reopen them only if the page is restored from the cache:
window.addEventListener('pageshow', (event) => {
if (event.persisted) {
//Reopen connections if needed
}
});
The notRestoredReasons API
Chrome has gradually (starting in October 2023) rolled out a feature to help developers understand why some web pages don’t benefit from its back/forward cache. This new tool, called notRestoredReasons, lets developers find out what prevents their pages from using this speed boost. This might include things like:
Specific settings preventing caching
Pages opened from other windows or tabs that aren’t ready to be cached
With notRestoredReasons, developers can identify and fix these issues, allowing more pages to use bfcache and improving speed and user experience on the web.
Test for bfcache Compatibility
Use Chrome DevTools to check if your pages qualify for bfcache:
Open DevTools > Application > Back-forward Cache.
Click Run Test to see if your page can load from bfcache.
If it fails, DevTools will provide guidance on issues you can fix.
By following these steps, you can ensure your site takes full advantage of bfcache, creating a faster, more seamless experience for your users.
If your page doesn’t have sensitive info that shouldn’t be restored, check if it’s eligible for bfcache and fix any issues. Tools like Chrome's bfcache tester can help you do this.
Core Web Vital trends in 2026
Google’s primary goal is to elevate web performance standards and boost overall user satisfaction.
That’s why the search engine continuously monitors user behavior to refine its Core Web Vitals metrics, ensuring they accurately reflect real-world user experiences. This ongoing evaluation leads to updates in measurement techniques and the introduction of new metrics, such as the 2024 replacement of First Input Delay with the superior metric Interaction to Next Paint.
Therefore, we should first explore what digital user trends are for 2026.
Digital Behavior in 2026
By 2026, the digital world will cater to users who demand speed, efficiency, and zero interruptions. Today’s trends show that people are increasingly impatient with even the slightest delays, and this impatience is only expected to grow. According to research, 53% of users will abandon a site if it takes more than three seconds to load. And as digital behavior continues evolving, users won’t just prefer seamless, instant experiences—they’ll expect them.
Why the shift? With faster networks and smarter tech, users are growing accustomed to rapid, optimized interactions across streaming, social media, and e-commerce platforms. As the Pew Research Center points out, busy, tech-savvy users value “friction-free” experiences that deliver value instantly. For businesses, this means that even a small delay could result in lost engagement or customers.
To keep up, websites need to prioritize not just speed but intelligence in navigation—knowing where users are likely to go next.
Google’s future plans
"The ideal user experience is never having to wait for a page to load."
Source: Google
Google acknowledges that traditional optimization tools and techniques can only take performance so far. There's a natural limit to how quickly data can move across the network and render on a page, and as you near that limit, each small improvement requires exponentially more effort. To reach truly instant navigation speeds, a radically different approach is needed—one that goes beyond traditional optimizations to redefine how we experience speed online.
In 2023, Google introduced the Speculation Rules API, signaling a significant shift toward instant digital experiences. This API allows developers to specify which pages the browser should prefetch or prerender, enabling near-instantaneous navigation and enhancing user satisfaction.
From fast to instant site loading
Instant page loading is revolutionizing site performance by meeting users’ demand for immediate access to content. This approach uses speculative rules to anticipate which page a user will likely visit next and preloads it, creating a nearly instant browsing experience. By eliminating load times, speculative navigations go beyond simply speeding up pages—they reshape the user experience, making it feel fluid and responsive. This seamless interaction reduces bounce rates and drives engagement, leading to higher conversion rates and a more satisfying user journey.
Implementation via Speculation Rules
Google's introduction of the Speculation Rules API marks a significant advancement toward achieving instant navigations. This API enables developers to instruct browsers to prerender or prefetch specific pages based on anticipated user behavior, thereby reducing load times and enhancing user experience.
However, manually configuring these rules necessitates a comprehensive understanding of user navigation patterns on a particular site. Without automation, there's a risk of inefficiently preloading pages that users may not visit, leading to unnecessary resource consumption.
Using AI for instant site speed
To address these challenges, Navigation AI by Uxify combines machine learning with real-time user data, automating the entire process. The tool makes a prediction about the navigation first and then sends the signal to the browser to speculatively load this page in the background.
By analyzing both past and current user interactions, it continuously adapts to where visitors are likely to go next, ensuring resources are used effectively and only for pages users will actually visit. This approach brings true instant navigations to life, with significant improvements in key performance metrics like Largest Contentful Paint, Time to First Byte, and Cumulative Layout Shift - turning instant navigation from an ideal into a game-changing reality.
By integrating predictive preloading into Core Web Vitals optimization, websites are not only better equipped to handle user demands but also stay competitive in search rankings, with fast-loading, user-friendly sites gaining an advantage. This makes instant navigations a cornerstone of the future for performance optimization in 2026 and beyond.

As we wrap up our exploration of Core Web Vitals, it’s clear that optimizing for these metrics is no longer optional; it’s essential. With Google’s continued focus on user experience, embracing improvements in loading speed, layout stability, and responsiveness will set you apart in an increasingly competitive digital arena. Not only will you enhance your search visibility, but you’ll also cultivate a loyal user base who appreciates a seamless experience. So, gear up for the journey ahead—implementing these optimizations is your ticket to a thriving online presence. Remember, every millisecond counts, and with Core Web Vitals in your toolkit, you're well-equipped to deliver the exceptional experiences that users crave.
Here’s to faster, smoother, and more engaging web adventures!

