See exactly where revenue is slipping
Reality unifies performance, engagement, and conversion data in one diagnostic platform. Every signal that impacts revenue, every breakdown that explains it, every what-if you need to act.
The first place to check every Monday morning
Skip the report digging. Reality and see what's costing you conversions - slow checkouts, broken journeys, missed clicks, and frustrated sessions.
Fixing top 3 issues will raise your checkout reach rate from 10.39% → 15.52%
- Page speed LCP 2.12% vs previous period, slightly worsening
- Missed clicks 2.74x vs general industry, sharply worsening
- Broken navigations 1.50x vs previous period, sharply worsening
- Broken style loads (desktop) 1.63x vs previous period, sharply worsening
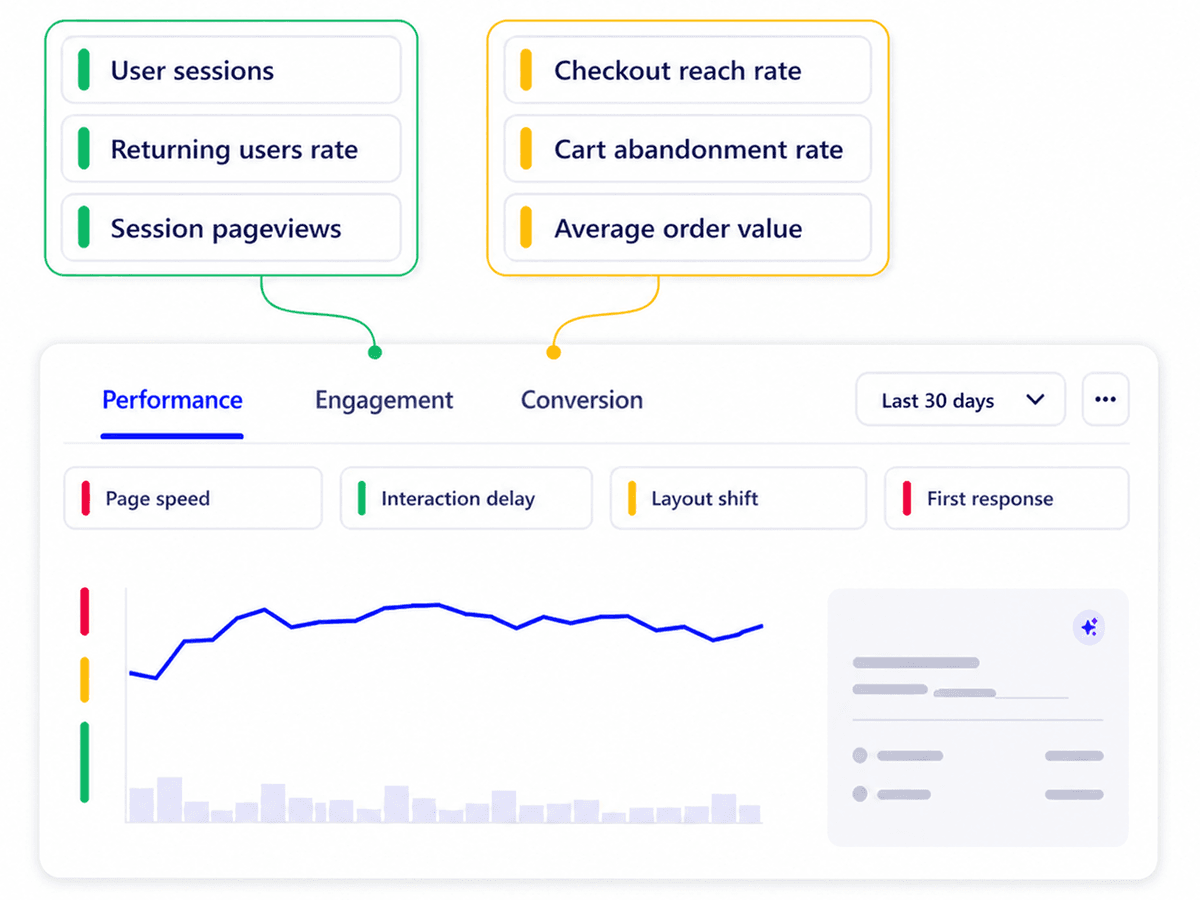
Find the performance issues costing you revenue
Track Core Web Vitals, perceived speed, and broken page elements, unsampled. Then see which ones hurt conversions.
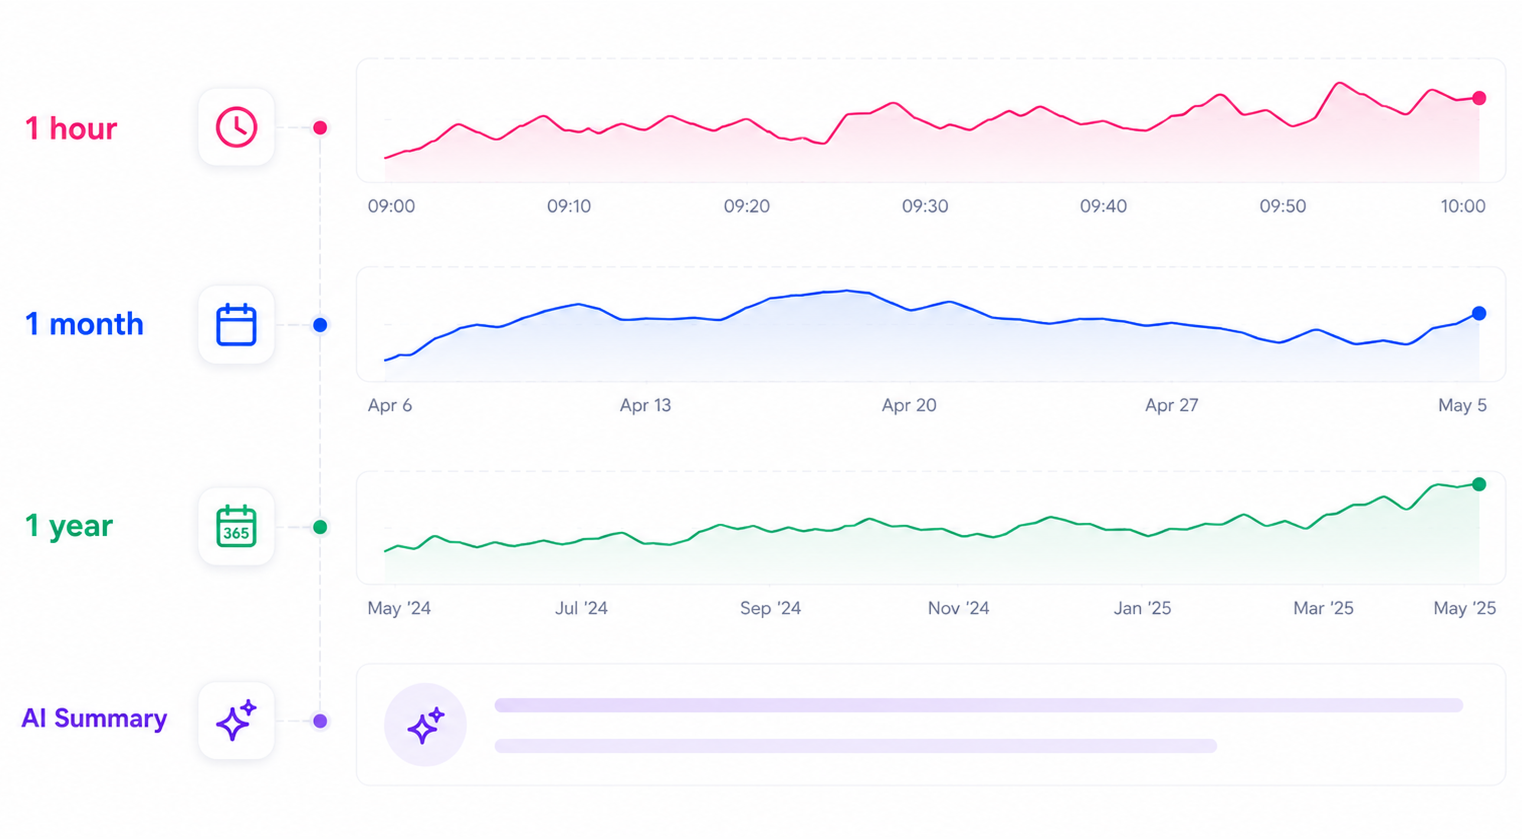
Understand your performance down to the minute.
Skip the spreadsheet detective work. Get hour-level performance data in near real time, with an AI summary that explains what changed, when, and which segments moved it.
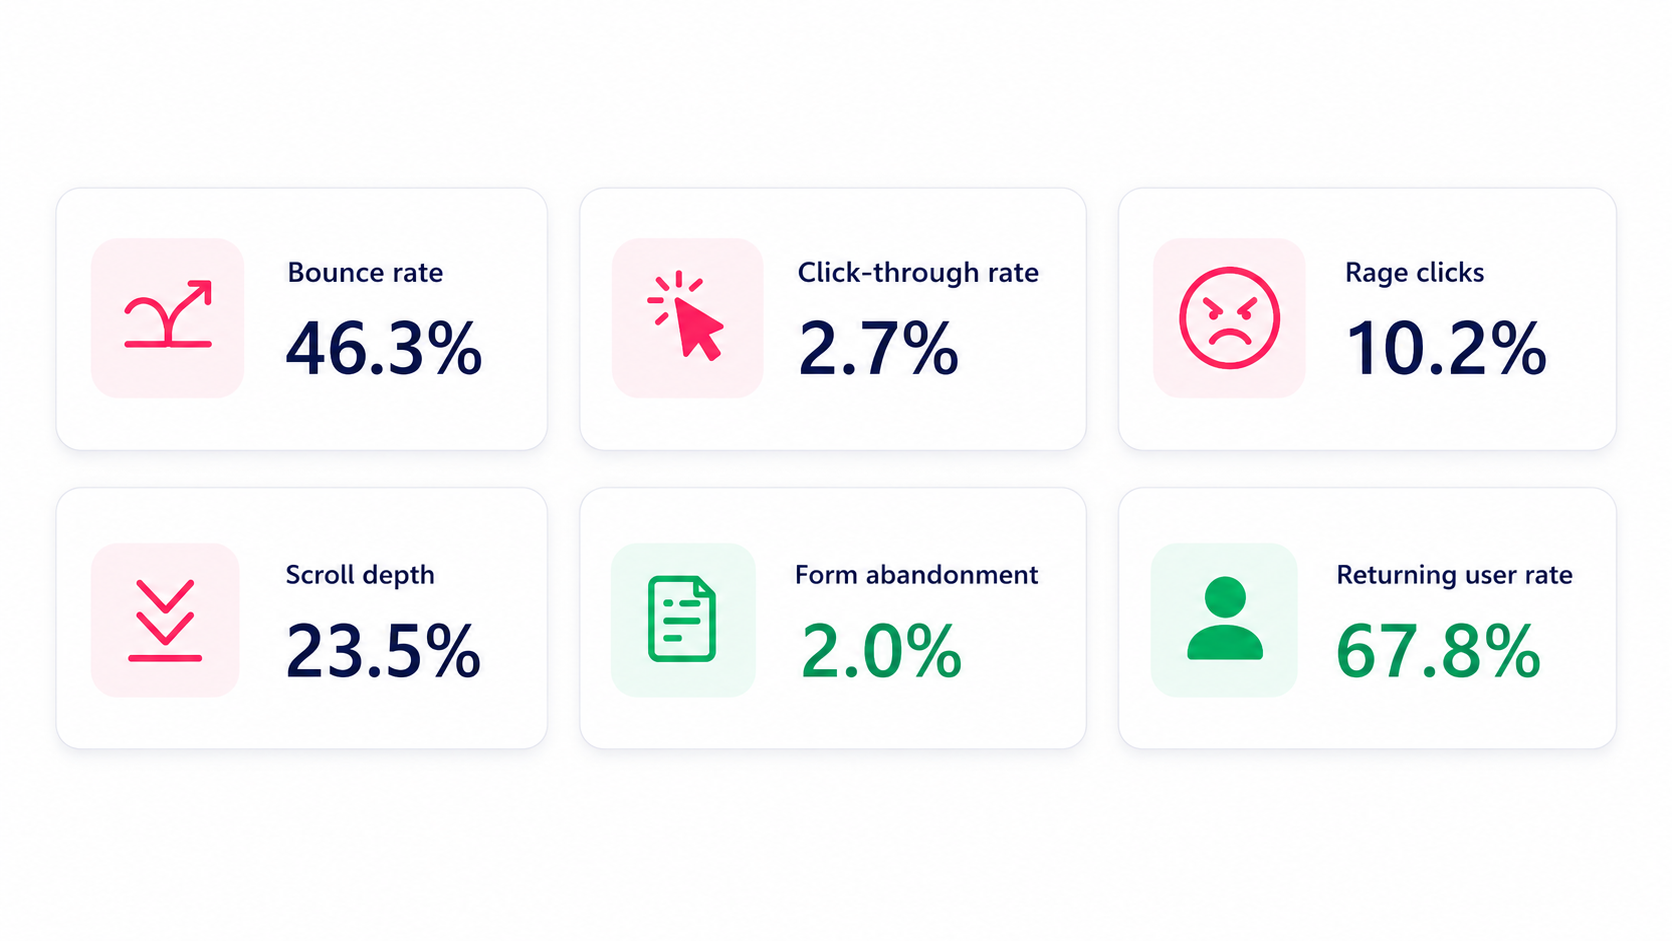
Find what gets in the way of engaged users
Reality tracks how users click, scroll, search, return, hesitate, and leave. See where engaged visitors slow down, get stuck, or drop off before they convert.
Understand what users are trying to do
See whether visitors are exploring, returning, searching, scrolling, or moving across multiple pages. Reality helps you separate real interest from traffic that lands, looks around, and leaves.
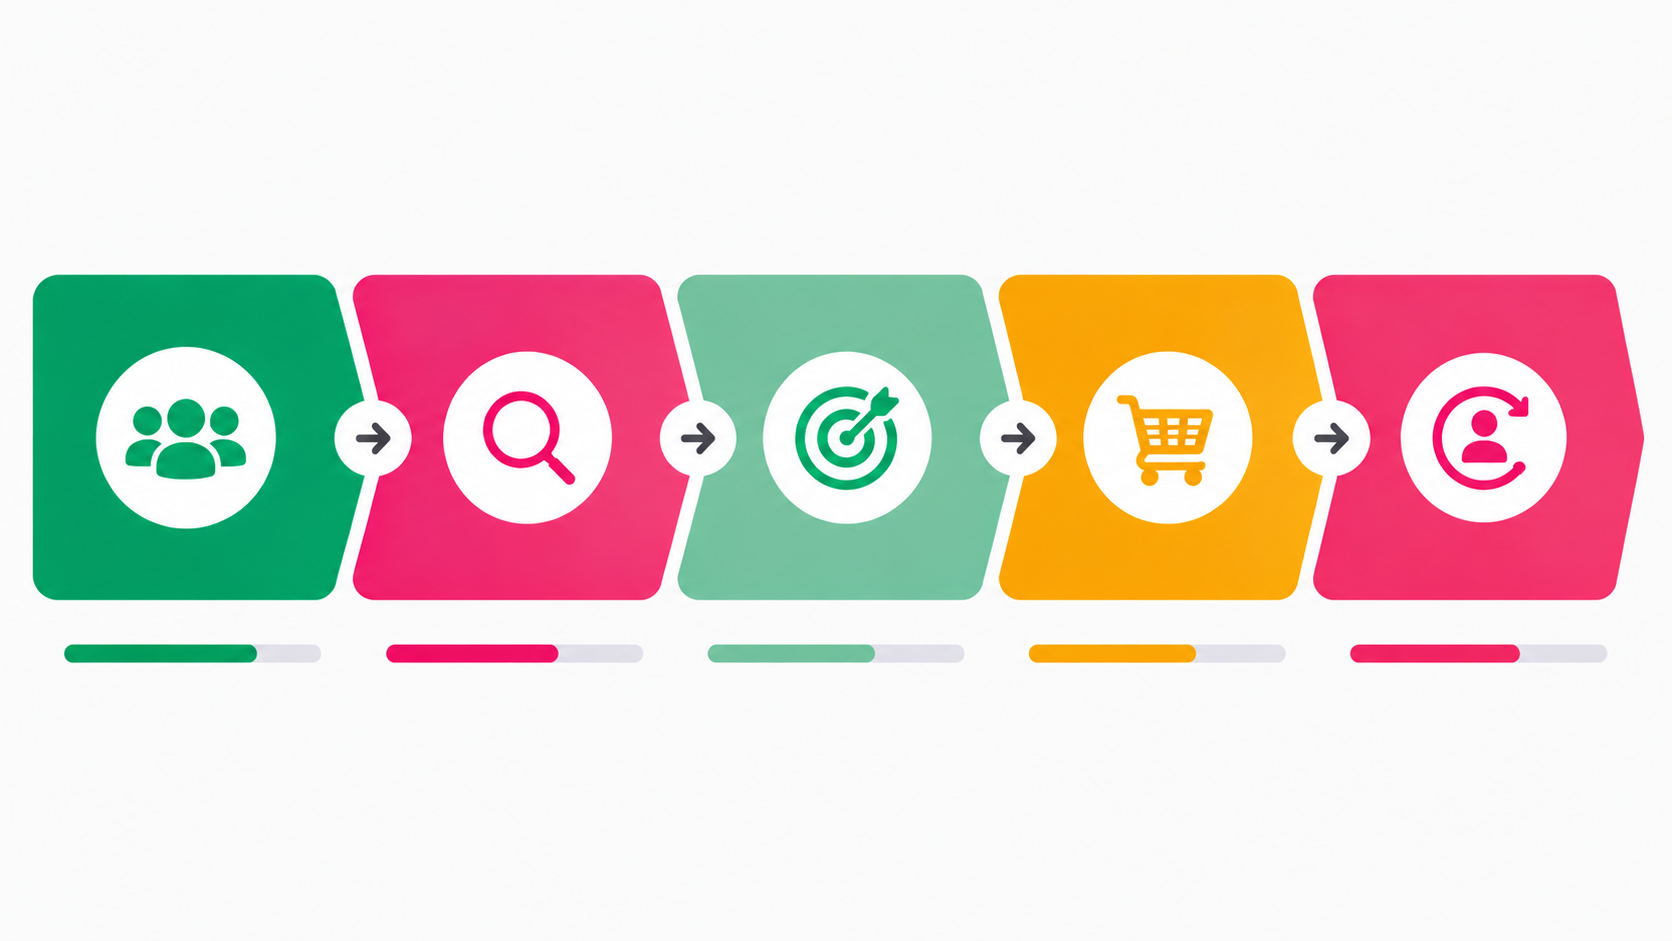
Connect every conversion to the experience behind it
Reality brings performance, engagement, and revenue data together automatically, so you can see why users buy, sign up, request a demo, or drop off without wasting hours for dev-heavy setups.
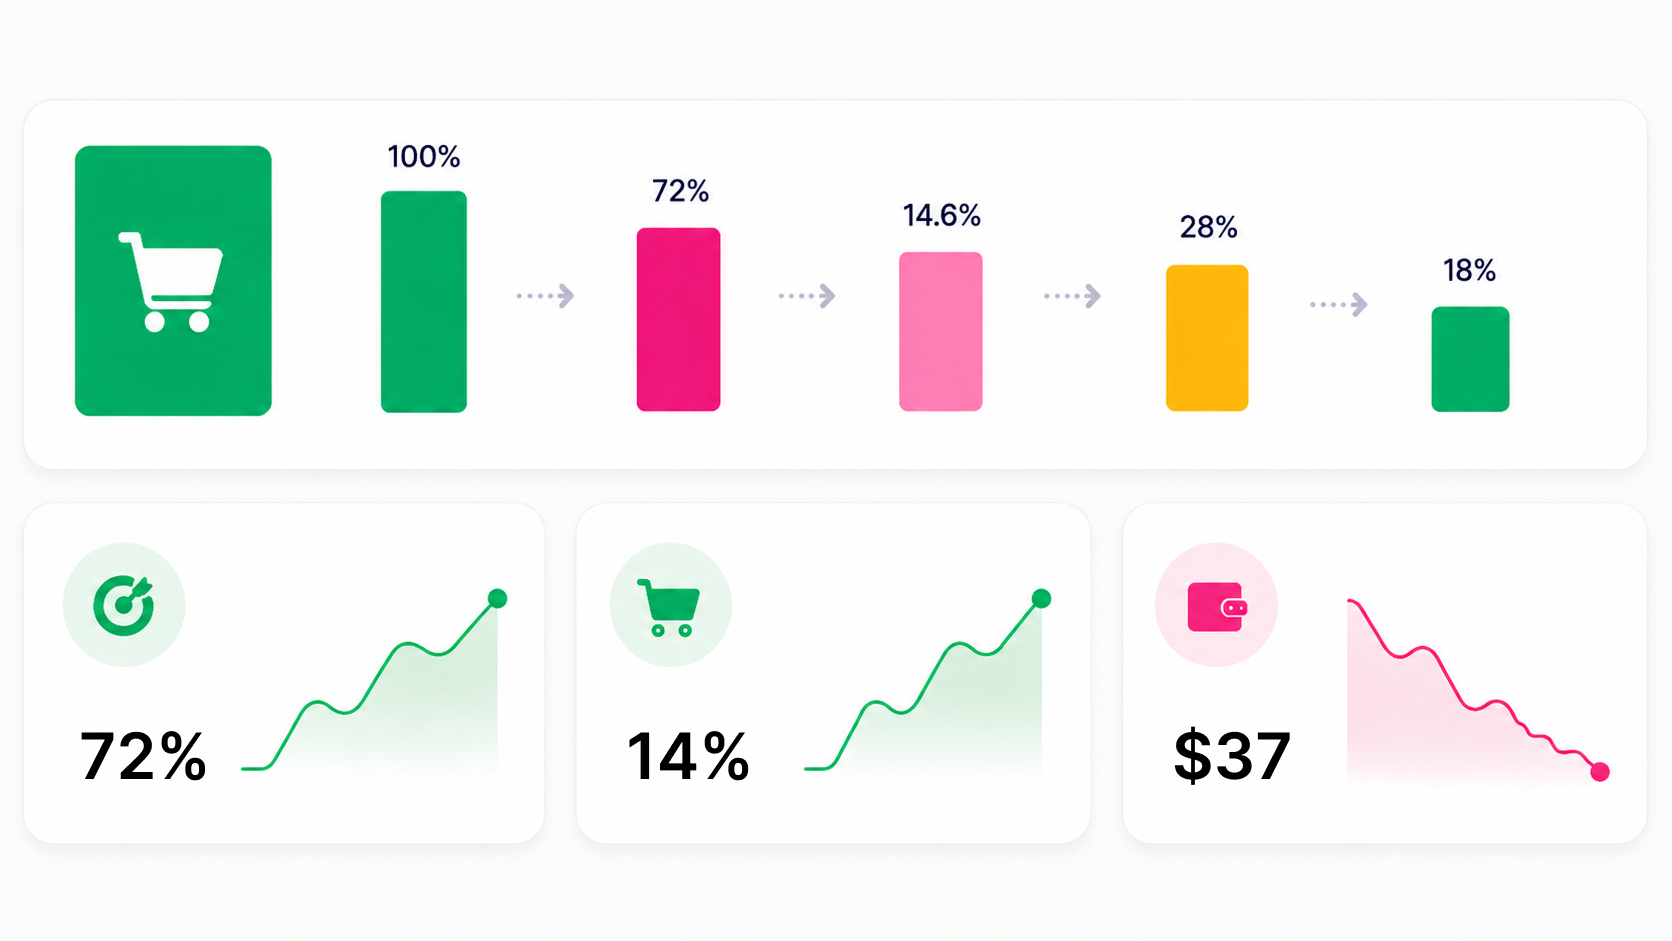
Track the conversion points that matter
Reality adapts to your business, whether you run an ecommerce store, SaaS product, or publisher site. Track purchases, AOV, signups, demo requests, form submits, content engagement and 20+ micro-conversions, or build your own custom funnel points.
Built into every view
Three workflows that work the same way across performance, engagement, and conversion data.
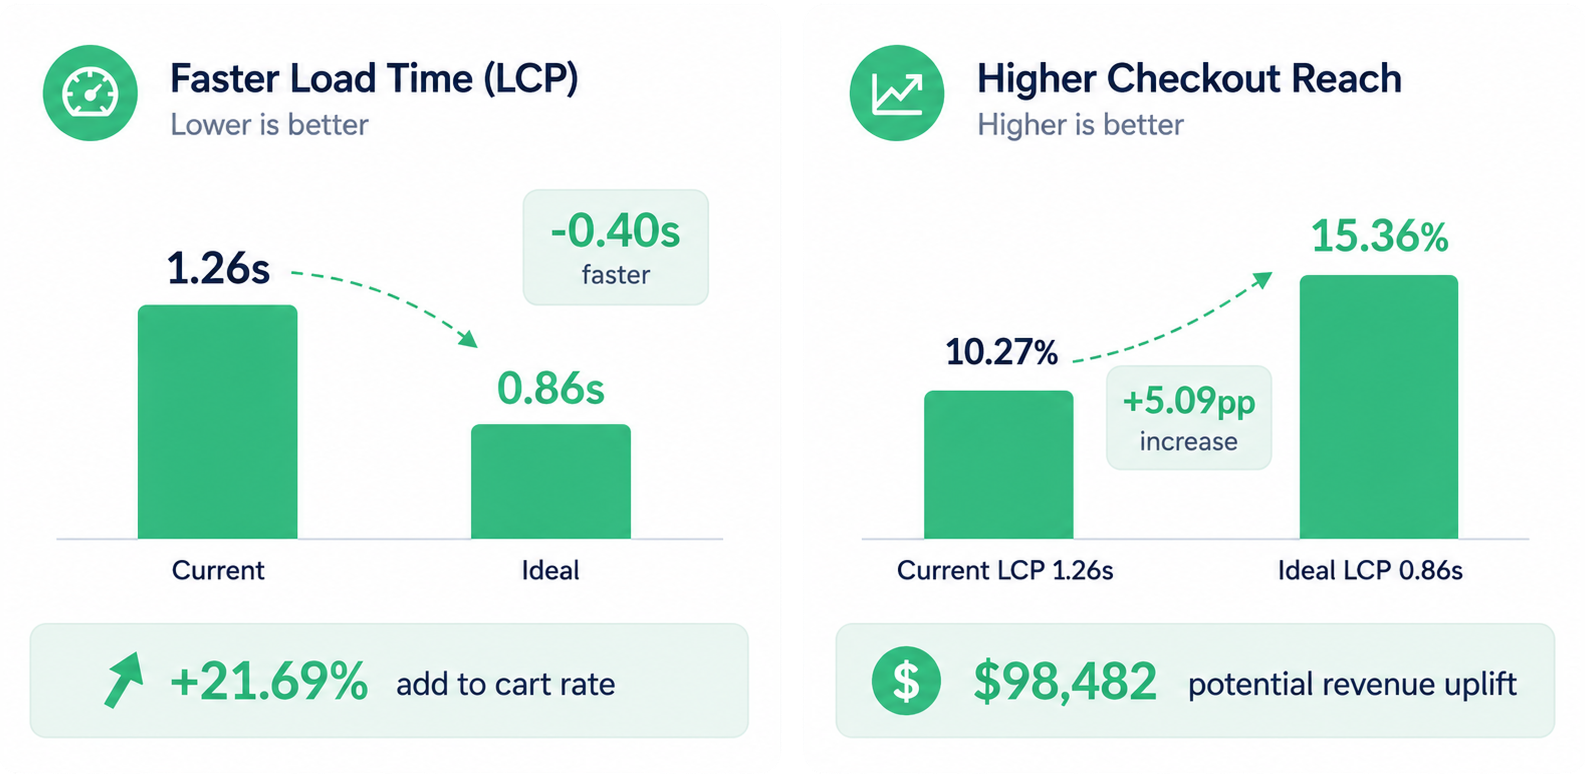
Simulate before you ship
See whether a fix is likely to move the metric before spending dev time. Test the possible impact first, then prioritize the changes worth making.
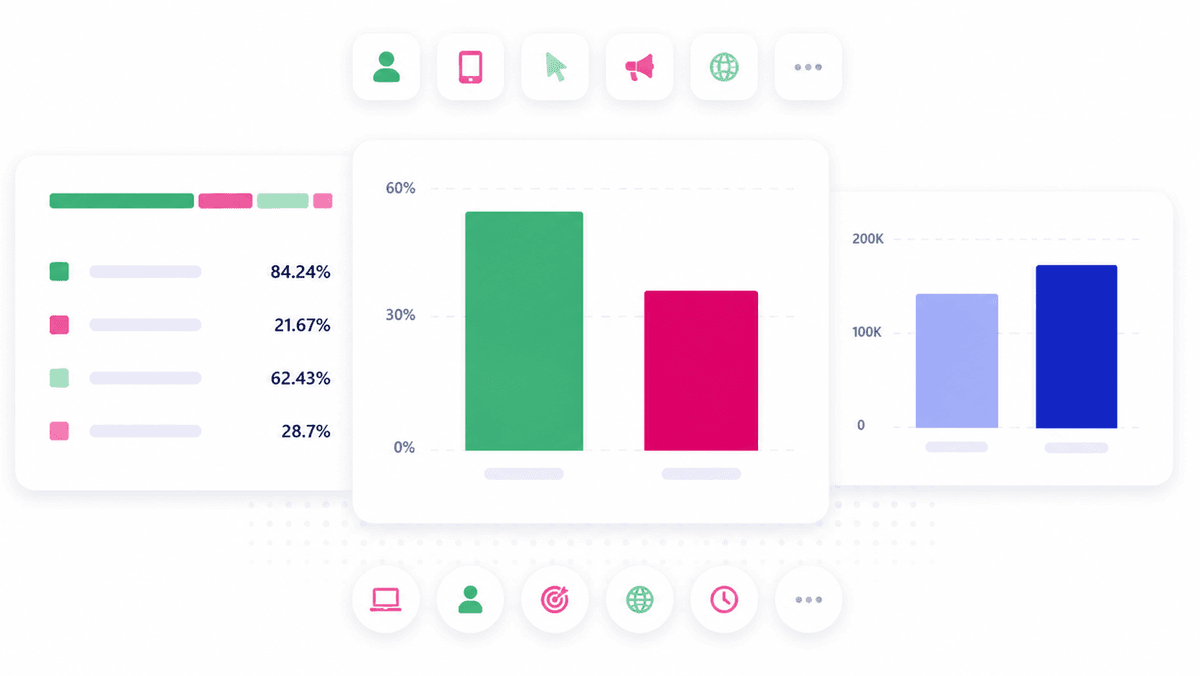
Compare anything to anything
Tell a real trend from an outlier. Compare your data to past periods, industry benchmarks, device type, or any metric you choose.
Ask Uxi about any number
Click any number and ask Uxi what is going on. Uxi explains the metric, shows the business problem behind it, and tells you what to fix next.
The difference
Uxify Reality vs. other RUM tools
- Business impact
- Perceived speed
- Agentic AI
- Metric simulation
- Safari & Apple support
- Custom metrics
- Data depth
- Links UX directly to conversions & revenue
- Measures how fast users feel the site is
- AI that finds issues, explains, and suggests fixes
- Test "what-if" scenarios before changes go live
- Full coverage, including Safari & iOS
- Define and track your own UX/business KPIs
- 3000+ signals captured (granular UX, funnels, personas)
- No ROI connection
- Not measured
- Static dashboards only
- Not available
- Partial
- Fixed metrics only
- Up to 2k signals
Consentmo campaign revenue up by 38%
Consentmo campaign revenue up by 38%
Consentmo used Uxify Reality to identify why their best-performing campaign wasn't converting as expected. CLS and LCP were within acceptable ranges, but three times slower than expected - creating friction at first impression and masking performance issues. Acting on those insights, Consentmo saw increased revenue, engagement, and a 38% lift in campaign ROI.
Most common questions
What is Reality in Uxify?
Reality is Uxify's diagnostic platform - one workspace that unifies performance, engagement, and conversion data for every real user. Instead of swapping between a RUM tool, an analytics tool, and a conversion tool, you see exactly where revenue is slipping and what is causing it, all in one place.
How is Reality different from Google Analytics or standard RUM tools?
Standard RUM tools stop at Core Web Vitals and generic averages. Google Analytics samples data and stops at clicks. Reality uses unsampled, real-user data and ties every technical metric (LCP, INP, CLS, TTFB, PLS) to engagement and revenue - then highlights the segments and pages actually costing you conversions.
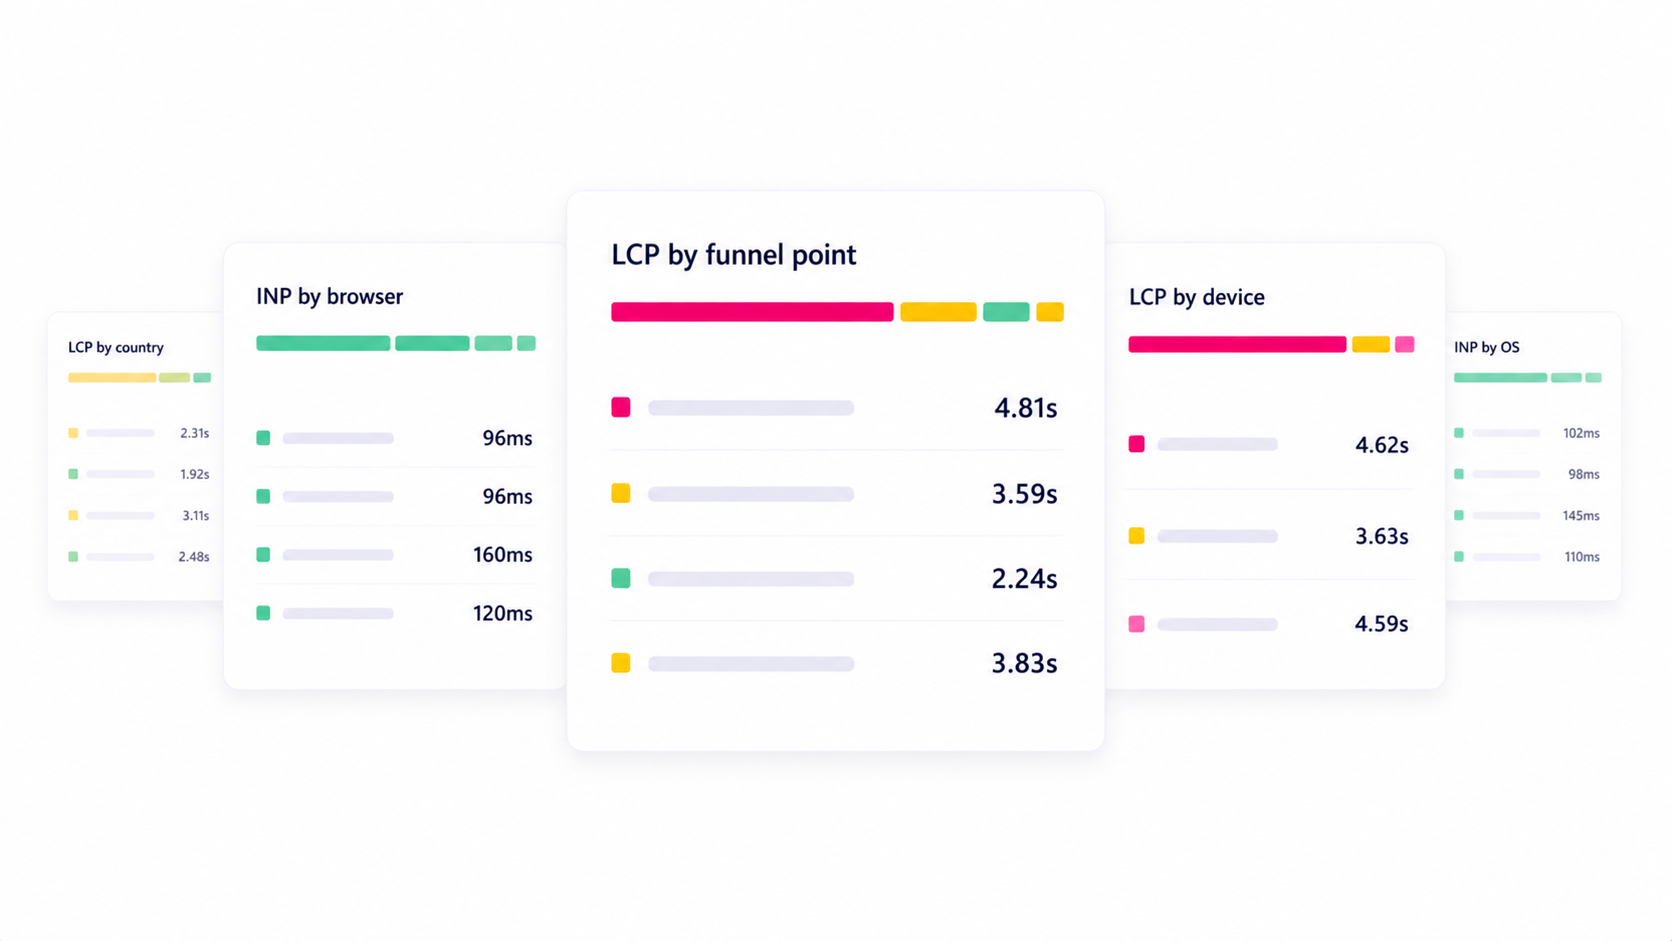
What can I diagnose with the Insights library?
Every metric in Reality can be sliced across 60+ dimensions - acquisition channel, device, country, browser, persona, funnel step, UTM campaign, landing page, and more. That means you can pinpoint the exact segment driving a bad LCP, a drop in engagement, or an abandoned cart, instead of guessing from a single average.
What does the Simulate feature do?
Simulate (available in the Performance tab) models the site-wide impact of a hypothetical fix before you ship it. For example, if most traffic lands on your homepage and LCP is slow, Simulate shows whether fixing only the homepage is enough to pass Core Web Vitals for the whole site - so you prioritize fixes that actually move the metric.
Can Reality explain why a metric changed?
Yes. Every graph in Reality comes with an AI summary that explains what changed, when it changed, and which segments drove the change for the selected metric, filters, and time range - from the last hour to the last year. You can also one-click Ask Uxi, Uxify's AI agent, for deeper follow-up questions on any number you see.
Does Reality work for ecommerce, SaaS, and publisher sites?
Yes. The Conversion tab adapts to your site type - ecommerce (AOV, cart abandonment, add to cart rate), SaaS (signups, demos, activation), and content sites (engaged sessions, scroll depth, return rate). Performance and Engagement tabs are universal, and the AI-enhanced insights calculate targets (like an ideal LCP for your checkout) based on your own conversion data, not generic benchmarks.