
Dynatrace looks after your servers. Uxify’s agents look after your visitors.
Uxify measures every real visit and finds what slows your visitors down. Its AI agents then get the next page ready before they click and make taps respond faster, so the gain shows in your conversion rate.
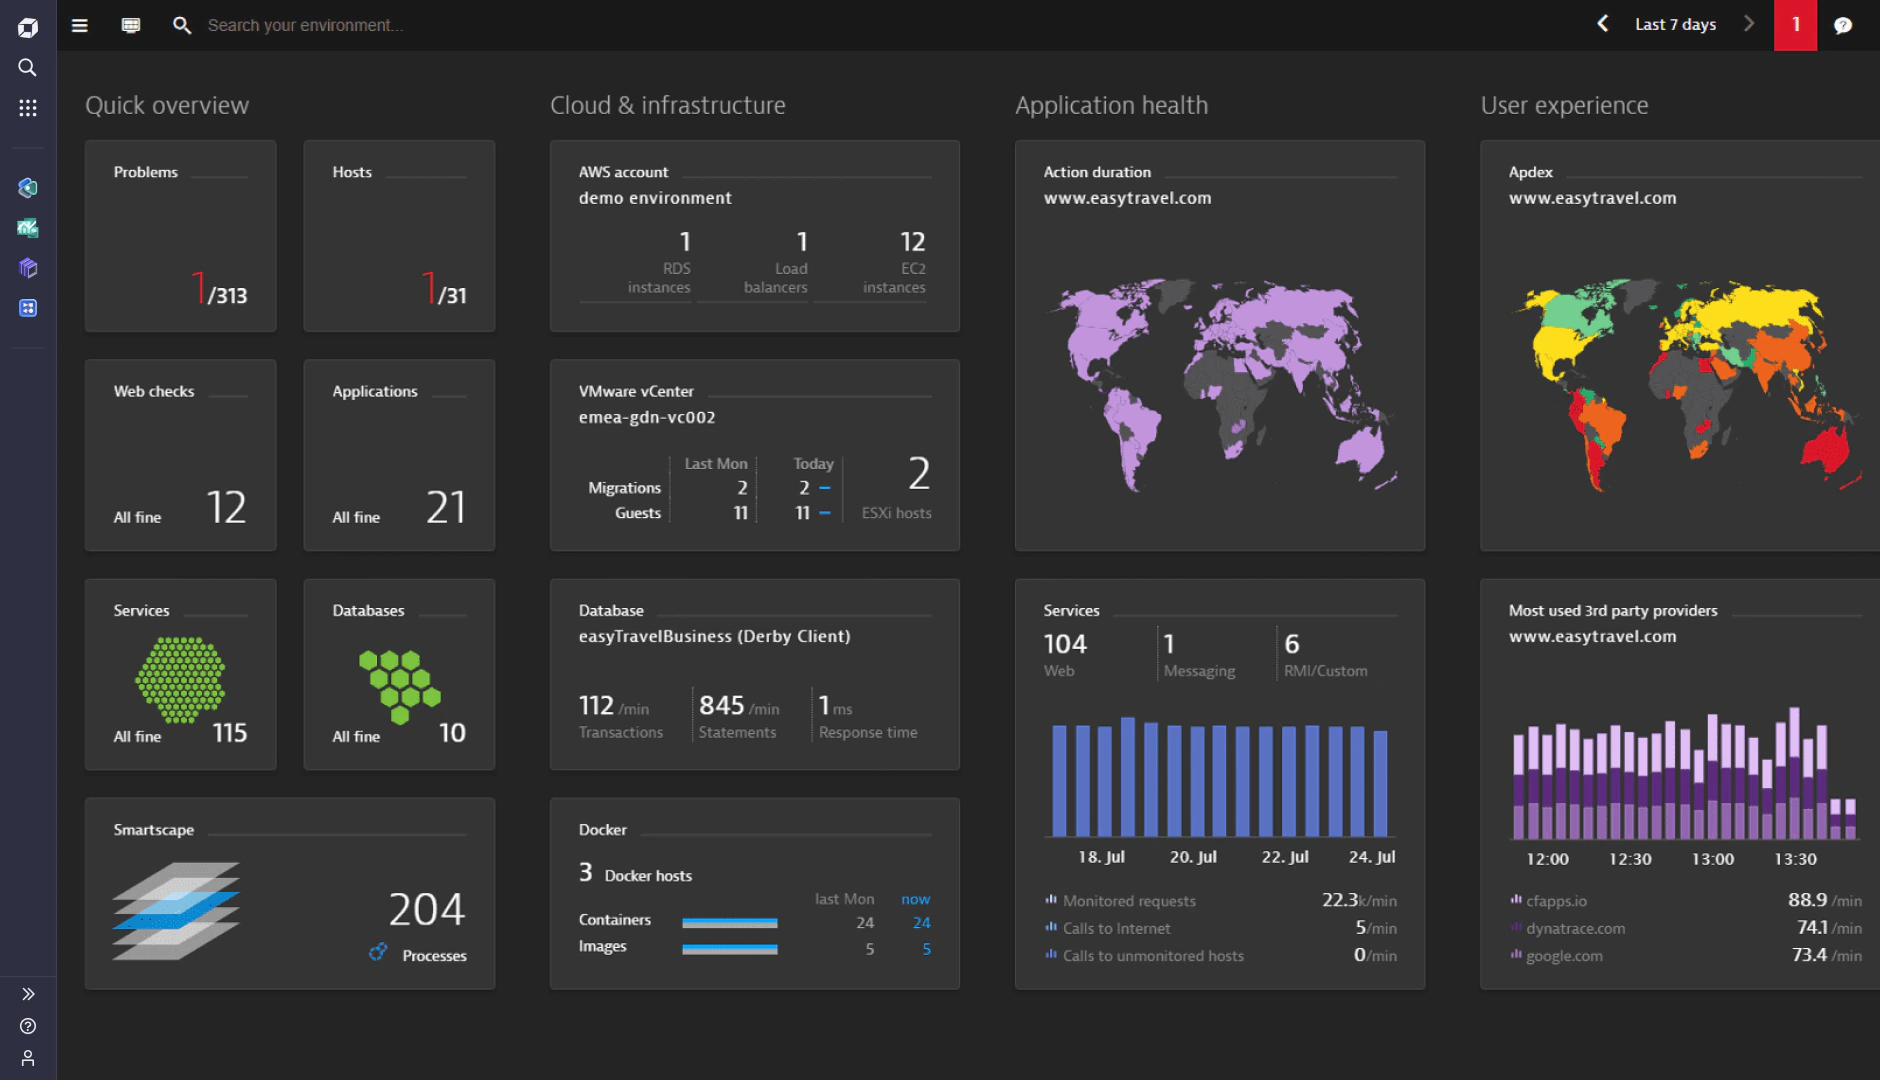

Root cause, found.
The frontend fix still needs a ticket.

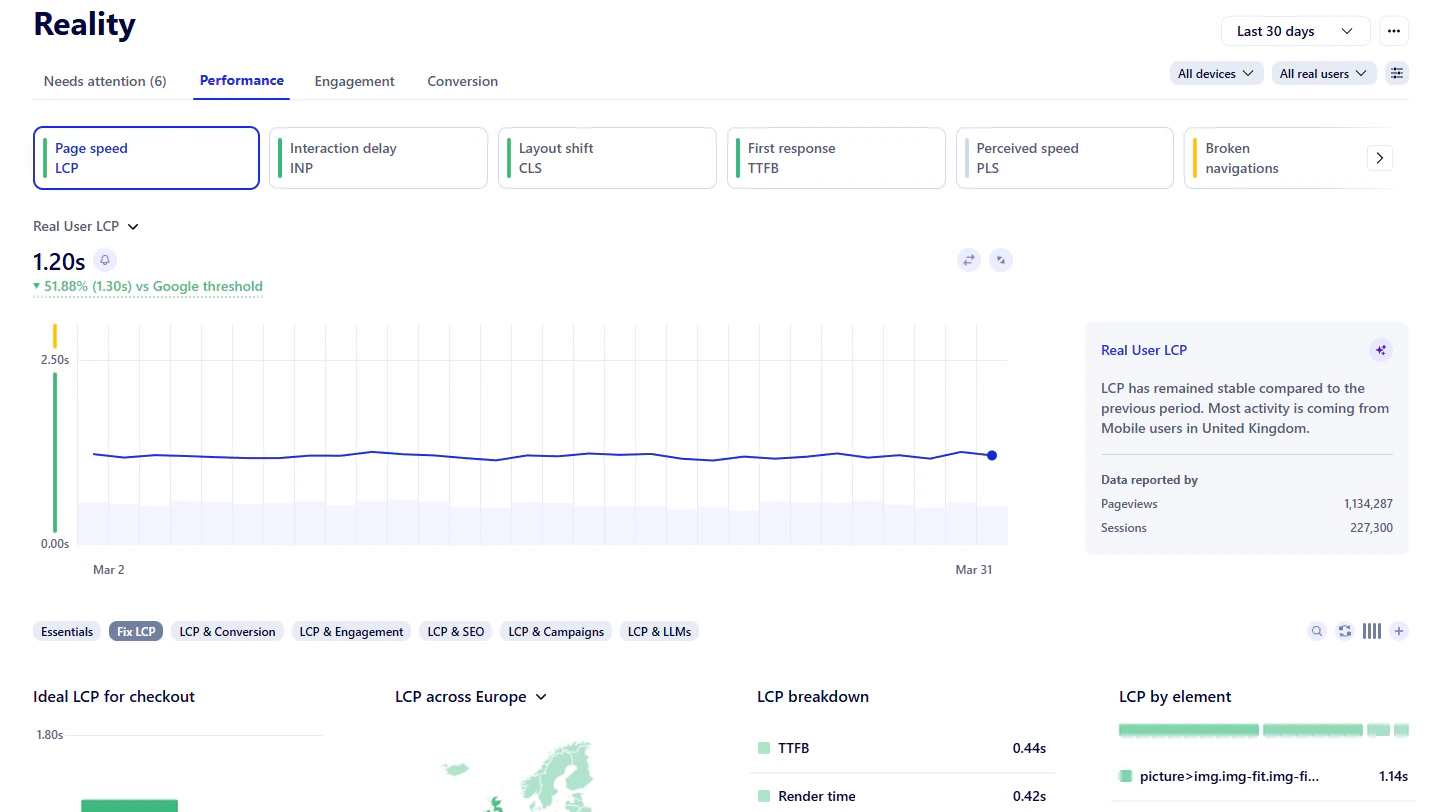
Regression caught.
Fixed on the live site, tied to conversion.
Why teams look for a Dynatrace alternative
Steep learning curve
A steep learning curve is the most common complaint about Dynatrace. Website teams have to work through hosts, logs and a custom query language (DQL) just to see why a page is slow.
Unscalable pricing
Every session is billed, and Session Replay costs twice as much. To control the bill, teams record only some sessions, so the slow visit they need often isn’t there.
Manual site optimization
Dynatrace shows why a page is slow, but its AI agents work on servers and security, not your site. Every frontend fix still needs a ticket, a sprint and a deploy.
Why website teams are looking for something simpler
Tips for Dynatrace alternative search
Most observability tools can tell you a page got slower. Few of them can fix it. Uxify tells you how much revenue it generates.
Does it fix the problem, or only find it?
A good alternative can apply improvements on your site automatically optimizing for better Core Web Vitals and user experience.
Can you measure the business impact?
A faster site only matters if it brings in more sales. Look for a tool that tells you how much revenue each optimization earned.
Can the website team run it on their own?
Reading Core Web Vitals shouldn't need DQL, custom dashboards or an observability engineer. One snippet or a GTM tag, first data within hours and answers in plain language is the bar.
Can you afford to see every visit?
When every session is billed, recording less traffic is the easiest way to cut cost, and the slow visits you need to see get left out. Look for a tool that measures every visit, unsampled.
Uxify vs Dynatrace
How both platforms handle real user monitoring, Core Web Vitals and what happens after a regression.
See the full comparison (9 more rows) Hide the full comparison
Why choose Uxify as your Dynatrace alternative?
Monitoring that sees every visitor, and agents that optimize your site.
Deeper data from every visit
Reality captures 3,000+ signals per visit. Speed, dead clicks, U-turns and loading exits sit side by side, with 60+ ways to break them down by page, device, country or campaign.
Agents that make pages faster
Uxify runs single-purpose AI agents aimed to remove friction moments like slow navigation between pages, laggy taps, missed clicks and performance drops that run 24/7 on your site.
Optimizations tied to conversion
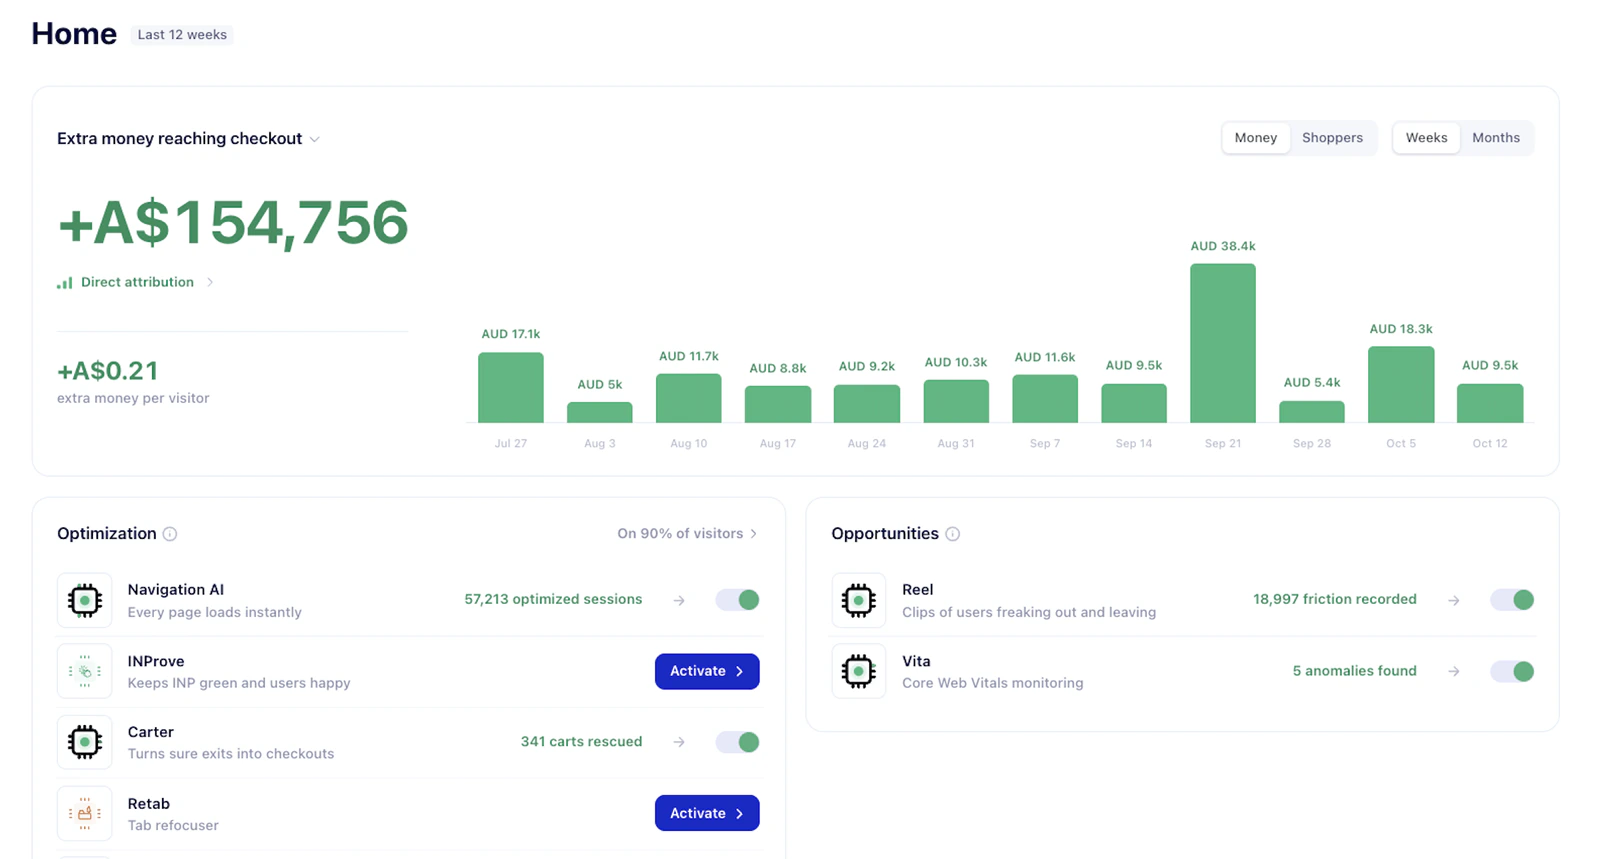
Uxify shows the revenue each agent and fix brought in, and sets your LCP, INP and CLS targets from your own conversion data. You always know which speed work pays off.
Ask Uxi, skip the query language
Uxi, the assistant built into Uxify, answers questions in plain language. It explains the cause and suggests the next step, with no DQL or dashboards to build.
Other Dynatrace competitors and alternatives to consider
| Tool | Best for | Main difference from Uxify |
|---|---|---|
| Datadog | APM, logs and RUM in one engineering platform | Fixes still need a developer |
| New Relic | Full-stack observability with a free tier | No tie to business outcomes |
| SpeedCurve | Synthetic tests and RUM side by side | No agents that optimize the site |
| DebugBear | Page speed audits with lab tests, CrUX and RUM | Diagnoses and recommends; every fix is still manual |
| Sentry | Tracking frontend errors and performance traces | Built for debugging code, not self-optimizing sites |
| Grafana Cloud Frontend Observability | Teams on the Grafana stack who want RUM | You build the dashboards and alerts yourself |
Why is Uxify the best Dynatrace alternative?
Dynatrace is built to keep your whole stack healthy, and it does that well. Uxify is built for the website: it measures every real visitor, catches regressions and uses agents to fix them in ways real users feel and your conversion rate shows.
Frequently asked questions about Uxify vs Dynatrace
What is the best Dynatrace alternative?
It depends on what you use Dynatrace for. If you need APM, infrastructure and log monitoring in one platform, Datadog and New Relic are the closest alternatives. If your goal is website monitoring and optimization, Uxify is the stronger Dynatrace alternative: it measures every real session on every browser and uses AI agents to make pages and interactions faster.
What is the difference between Uxify and Dynatrace?
Dynatrace is a full-stack observability platform that monitors applications, infrastructure, logs and digital experience, then helps engineers find the root cause. Uxify focuses on the website: it measures Core Web Vitals and behavior from every real visitor, catches regressions per page and device, and runs agents that fix them live on the site.
How much does Dynatrace cost?
Dynatrace sells a Dynatrace Platform Subscription: you commit to an annual spend, then usage is drawn down at rate card prices, with lower rates for larger commitments. At list price, Real User Monitoring is $0.00225 per session ($2.25 per 1,000), RUM with Session Replay is $0.0045 per session, browser monitors are $0.0045 per synthetic action and Full-Stack Monitoring is $0.01 per memory-GiB-hour. Single-action bounced sessions aren't billed, and a visit longer than an hour counts as an extra session for each hour started.
Is Dynatrace free?
No. Dynatrace has no permanent free plan. You can try the full platform free for 15 days, and after that you need an annual subscription.
Does Dynatrace sample RUM data?
Dynatrace lets you choose what share of user sessions RUM captures, with a separate capture rate for Session Replay. Because each captured session is billed, lowering that share is the main way to control RUM spend. Uxify measures 100% of sessions, unsampled, on every browser including Safari and iOS.
Can Uxify replace Dynatrace?
For website optimization and Core Web Vitals, yes. If you also rely on Dynatrace for backend tracing, Kubernetes or logs, keep it for that work and run Uxify alongside it for the website.