Key takeaways:
- Funnels are fully live, and they're built automatically from the paths your visitors actually take, not the ones you assume they take.
- Reality now counts abandoned orders as a number rather than only a rate, and tracks form abandonment down to the individual form and the page it sits on.
- Navigation AI reports extra product pages viewed per visit, so "faster browsing sells more" stops being an argument and becomes a figure.
- Every agent now sends you a regular report of what it did and what it earned, wherever you want to receive it.
- A new install route through Cloudflare, automatic team joining, one dashboard for all your sites, and dark mode.
Make Uxify one of your go-to sources on Google
 Add Uxify on Google
August is notoriously known for its summer slump. People go on holiday, temperatures are too high to concentrate on anything, and everyone is taking a breather before the busiest time of the year starts.
Not Uxify.
We’ve been working on some pretty big items this month and we’re excited to share them with you. This month’s releases were all about giving you a deeper look into your data and how agents work, along with some improvements in team and agency management. One of them is a whole new feature that’s been highly requested for a few months now. Read on to see which one I mean:)
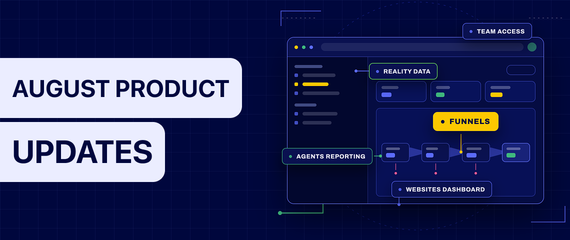
- New Feature: Customer funnels
- Abandoned orders, as a number
- Form abandonment, by element
- More products seen per visit, from Navigation AI
- Agent reporting
- Automatic team joining
- Installing through Cloudflare
- One dashboard for all your sites
- Dark mode
Part one: seeing where you lose people
Q3 is the time to understand your funnels, where people drop off, and which paths need optimization - just in time for Black Friday preparations. So a big chunk of this month went into visibility: finding your leaking buckets while there’s still time to fix them before the holiday season.
Funnels show you where you lose people. The new abandonment counts show you how much that costs. The form data shows you which specific thing is doing the damage.
New Feature: Customer funnels
A funnel is the path you want a visitor to take, step by step, from landing on your site to buying. It’s one of the fundamental things when selling on your site, and a key element of conversion rate optimization.
So you map out the user journey, set the key milestones, tag them in your software and start tracking how well your funnel performs. But there’s one big problem with that. Customer journeys are far less predictable than the ones we draw, and relying only on the funnels you built by hand leaves you with a big blind spot: you never see where your customers actually pass through before they buy.
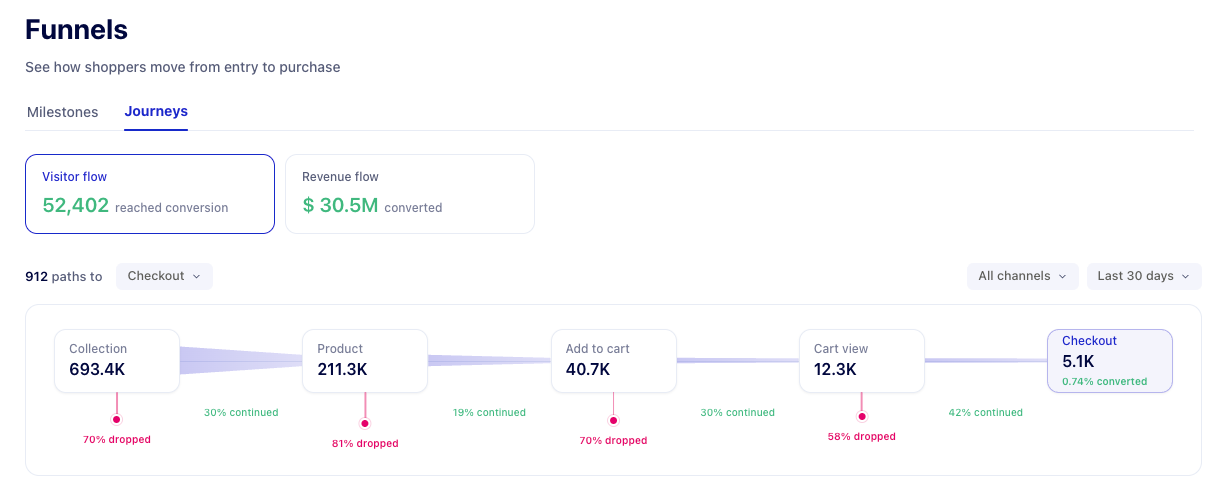
In Uxify it works the other way round. Open the funnels section and your funnels are already there, built from what your visitors actually do rather than what you assume they do. Every real path through your site feeds the funnel, so what you’re reading is your customers’ behavior rather than your assumption about it. It also keeps up with you: launch a new landing page or change your navigation, and the paths shift on their own to reflect that change, with no graph to remember to update.
How the setup works
The starting point is your industry. The milestones that matter for a fashion store aren’t the ones that matter for a vape shop or a B2B SaaS site, so the default steps come from what your kind of business normally looks like. You’re not starting from an empty screen, and you’re not starting from a generic template either.
Then, the traffic across the rest of your pages is analyzed for additional milestones worth adding. These are usually the interesting ones, because they’re the pages you never thought of as part of the funnel: a size guide, a delivery information page, a comparison table, a reviews tab. If a lot of people who buy pass through something first, that’s worth knowing.
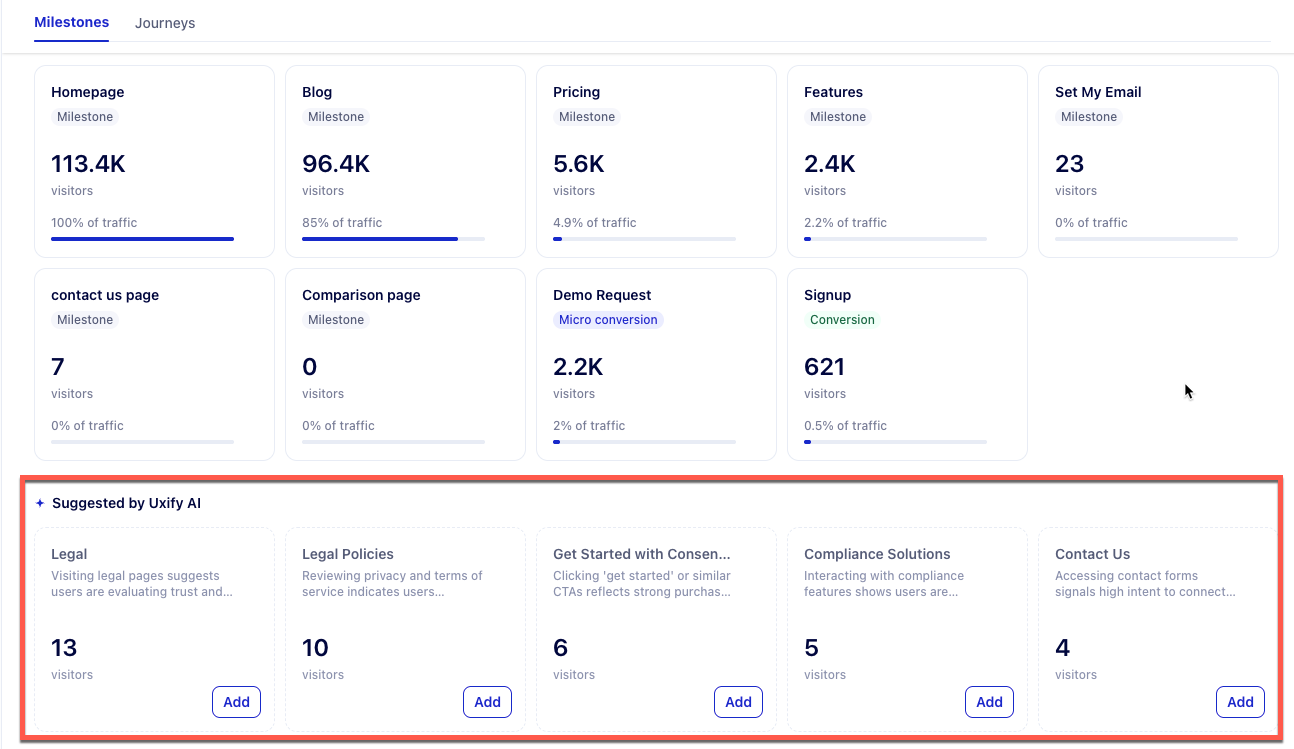
From there it’s yours. Accept the suggestions, ignore them, or add your own steps however you like. A milestone can be a URL, or a mouse click on a specific element, so you’re not limited to things that happen to have their own page address. A “size guide” modal, an “add to cart” button, a tab that opens the returns policy - if a visitor can click it, you can measure it as a step.
How to get the most value out of funnels
Go step by step and read the conversion rate between each pair of milestones. You’re looking for two different things, and they don’t always point at the same step.
The first is the biggest drop. Wherever conversion falls hardest between one step and the next is where you’re losing the most people, and fixing that is the biggest win in terms of traffic.
The second is where you’re losing the most money, and that’s a different calculation. Traffic isn’t revenue. The further down the funnel someone gets, the more they were worth to you, because they were closer to buying and cost more to bring in to begin with. So a modest drop at the last step before purchase can cost you far more than a dramatic one near the top. Weigh each step by the revenue moving through it rather than the visitors, and the priority list often reorders itself completely.
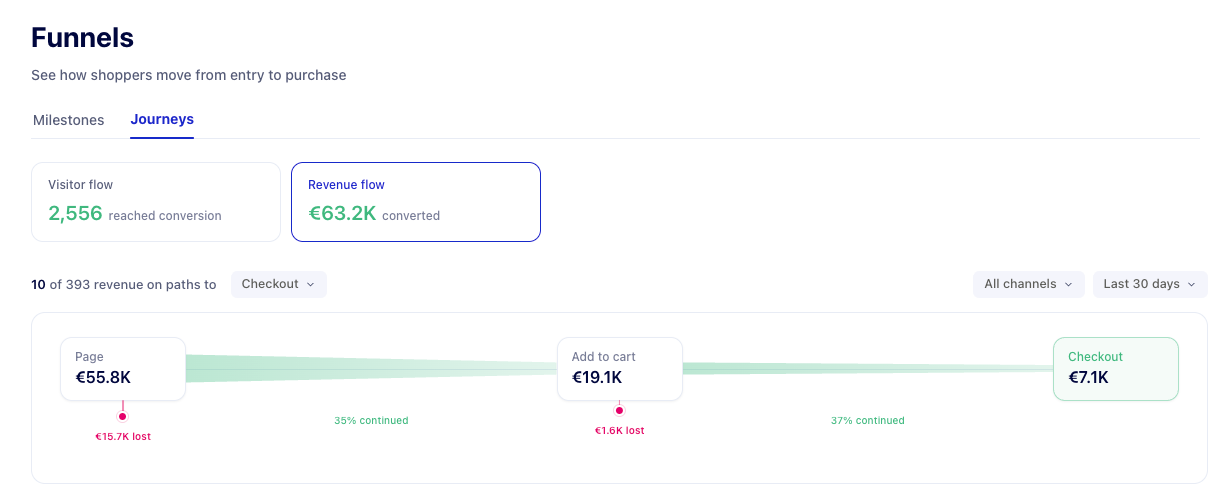
Fix the biggest drop for volume. Fix the late-stage drop for revenue. If you can only do one thing this month, do the second one.
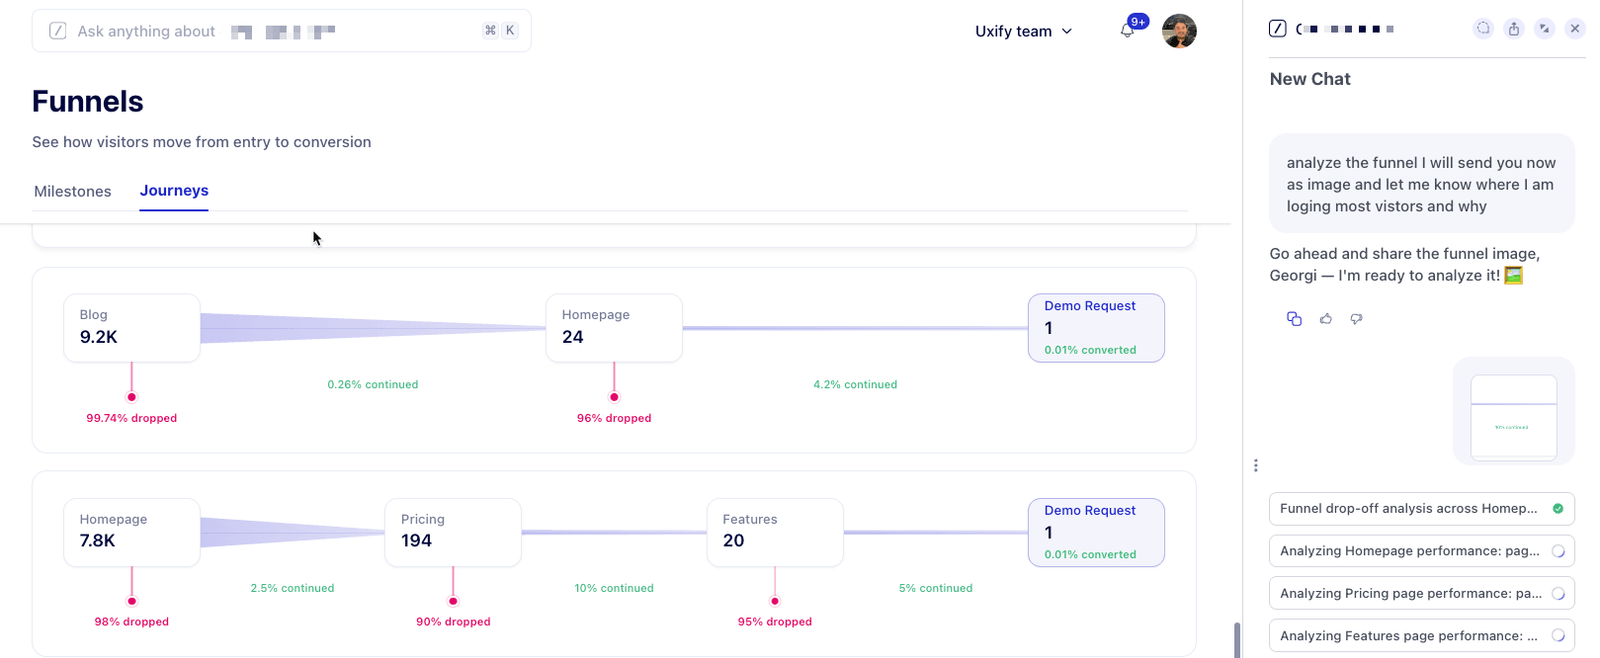
PRO tip: once your funnel is set up, ask Uxi to analyze it for you. Describe what you’re seeing, and it will go through your own data, tell you where the leaking buckets are, and give you the fixes you should focus on first. Much faster than staring at the chart on your own, and it will spot things you’d scroll past.
Abandoned orders, as a number
Reality is the layer that records what real visitors do on your site, and everything else in Uxify reads from it. In the conversions section you’ve always had a cart abandonment rate. Now you get the total number of abandoned orders next to it, in the same view. A rate tells you how bad the problem is. The count tells you how big it is. Having both in front of you makes it much easier to decide whether something is worth fixing this month, and much easier to explain to someone else why that is.
Form abandonment, down to the form and the page
Carts often get all the attention, because everyone knows what an abandoned cart costs. But your forms and how people engage with them are just as important. One of the most valuable things a form gives you is first-party data: a name, an email, and a signal about what that visitor is interested in.
The form abandonment rate itself is not new. What is new is a widget that breaks it down by element, so the rate turns into an address. You see which form elements exist on the page, which of them your customers abandoned, and exactly where in the form the abandonment happened, laid out visually on the page it belongs to.
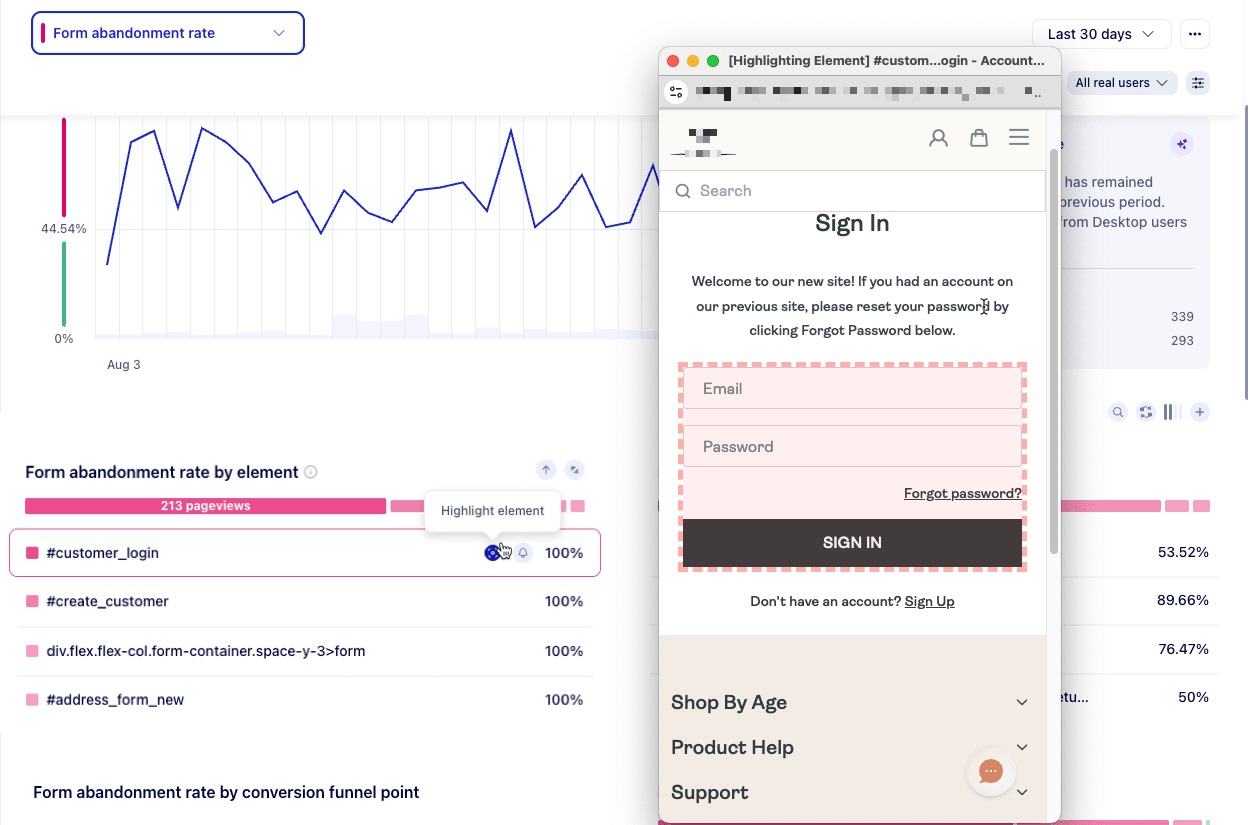
That’s what turns the metric into a decision: which form to improve, which to remove, and which to leave alone.
PRO tip: we’re currently beta testing an agent that automatically helps you recover abandoned forms. Keep an eye out for it, because it turns this from something you diagnose into something that gets handled proactively and ongoingly.
Part two: your agents show their work
Your agents are working around the clock on jobs that used to sit in somebody’s backlog. This month they started showing you what all that work adds up to.
Two releases here. Navigation AI now puts a number on what faster browsing does for your catalogue, and every agent sends you a regular summary of what it did and what it earned. Same work as before, now with the results in front of you.
Navigation AI now shows how many more products people see
Navigation AI is the agent that makes moving around your site feel faster. It works out where a visitor is likely to click next and loads that page before they get there, so the click lands on a page that’s already waiting.
The argument for it has always been that when browsing feels quicker, people look at more of your catalogue. Reasonable, widely believed, and until now not something you could easily prove.
This month it became a measurement. Navigation AI’s results include extra product pages viewed per visit, comparing sessions the agent optimized against sessions it didn’t. You get the lift as a percentage and, more usefully, as a plain count: how many more products the average visit actually reaches.
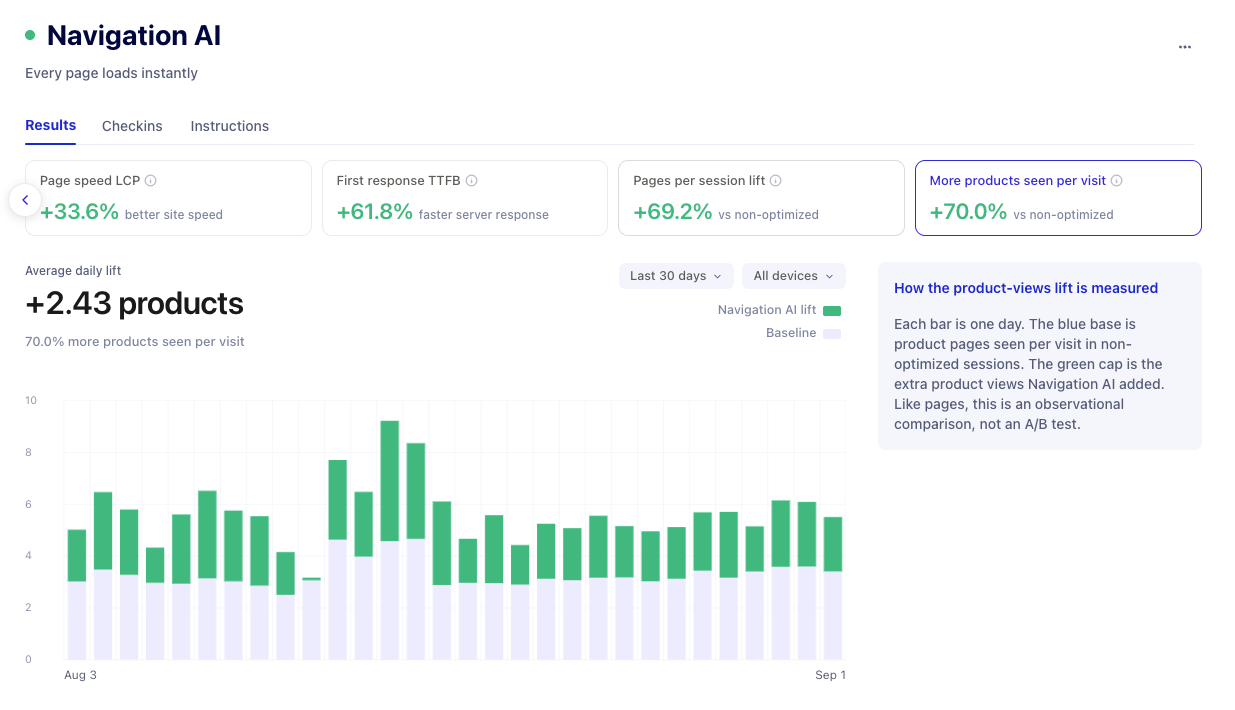
The honest caveat: the comparison runs between optimized multipage sessions and non-optimized ones, which makes it an observational comparison rather than a strict A/B test of like against like.
For what the agent does to earn that number, the case studies are the fuller picture. Ecigone increased engaged sessions by 22% and repeat traffic by 9%. eCommerce Fastlane grew pageviews per session by 26% and cut rage clicks by more than half, without changing a single article.
Agents now report back
Setting an agent up is a series of steps. You choose the goal, you set the guardrails, you tell it what it’s allowed to touch. This month a final step joined that list: reporting.
Every week or every month, whichever you pick, the agent sends you a summary of what it did. What it changed, what it earned, how it performed against the goal you gave it. It’s the same arrangement you’d have with anyone else doing the work for you: you agree what they’re responsible for, and then you get a report.
You also choose where that report lands - by email, in Slack, in-app or by SMS, so it turns up somewhere you’ll actually read it.
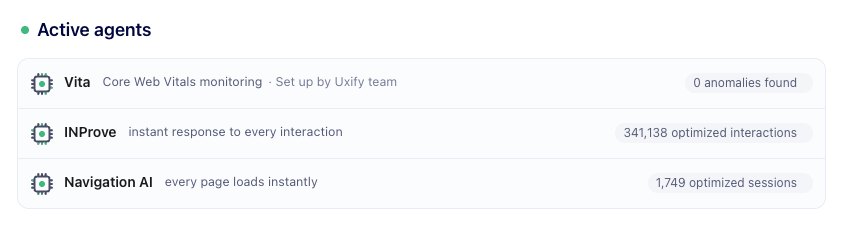
Additionally, your Agents dashboard now gives you a bird’s-eye view of how your site has improved since the agent went live with the KPI the agent is optimizing for.
Part three: getting started with Uxify made easier
Getting started with a tool should be the easiest thing you do. Uxify is in the business of removing friction, so the onboarding got “uxified” too, and the path to your account is a good deal shorter this month.
Joining the right team, automatically
Signing up is one thing. Landing in the right account is another. In a team, and especially in an agency, where account executives sign up at different times, it’s easy for someone to end up on an account of their own, with their client’s data disconnected from the main account.
Every Uxify plan comes with unlimited seats, so there is no reason for anyone to sit outside the team. The catch was that someone had to send the invite first.
Now it happens without you. Sign up with your work email and, if a team is already using that domain, you’re shown it and offered a place on it. No invite to chase, no approval to wait for.
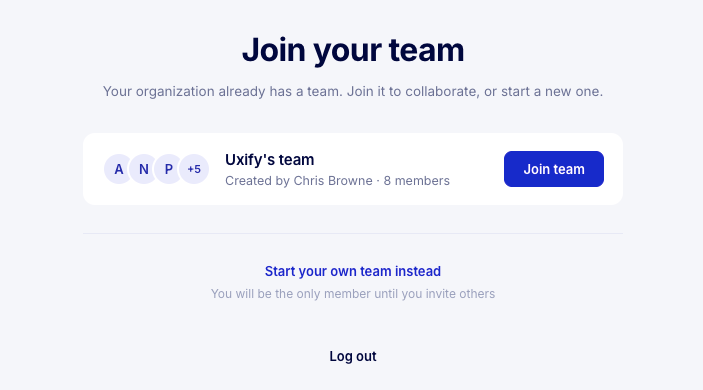
The same goes the other way. If you’re on an account outside the team and try to add a site your team already manages, you’ll be informed, so you can join and get that site’s data instead of building a duplicate next to it.
Install through Cloudflare
If your site sits behind Cloudflare, you can now install Uxify from there. No template to edit, no deploy to wait for - you turn it on and Uxify starts collecting. This needs a Cloudflare Pro plan or above.
That makes four routes onto your site, and the right one depends entirely on who’s doing the installing rather than which sounds most technical.
- Control the theme? Paste the snippet.
- Don’t? Email it to whoever does, and carry on setting up your account while they get to it.
- Want to avoid code entirely? Google Tag Manager.
- On Cloudflare Pro? That’s the fewest clicks of the four.
Whichever you pick, the thing to avoid is stalling. Getting the snippet live is usually the only thing standing between you and your first real data, and every week it isn’t live is a week of sessions that go unmeasured.
Part four: an overview of all your sites
If you look after more than a few sites, opening them one by one eats your morning. The websites dashboard now puts every site on a single screen. You choose which metrics to follow, and each site is listed against them.
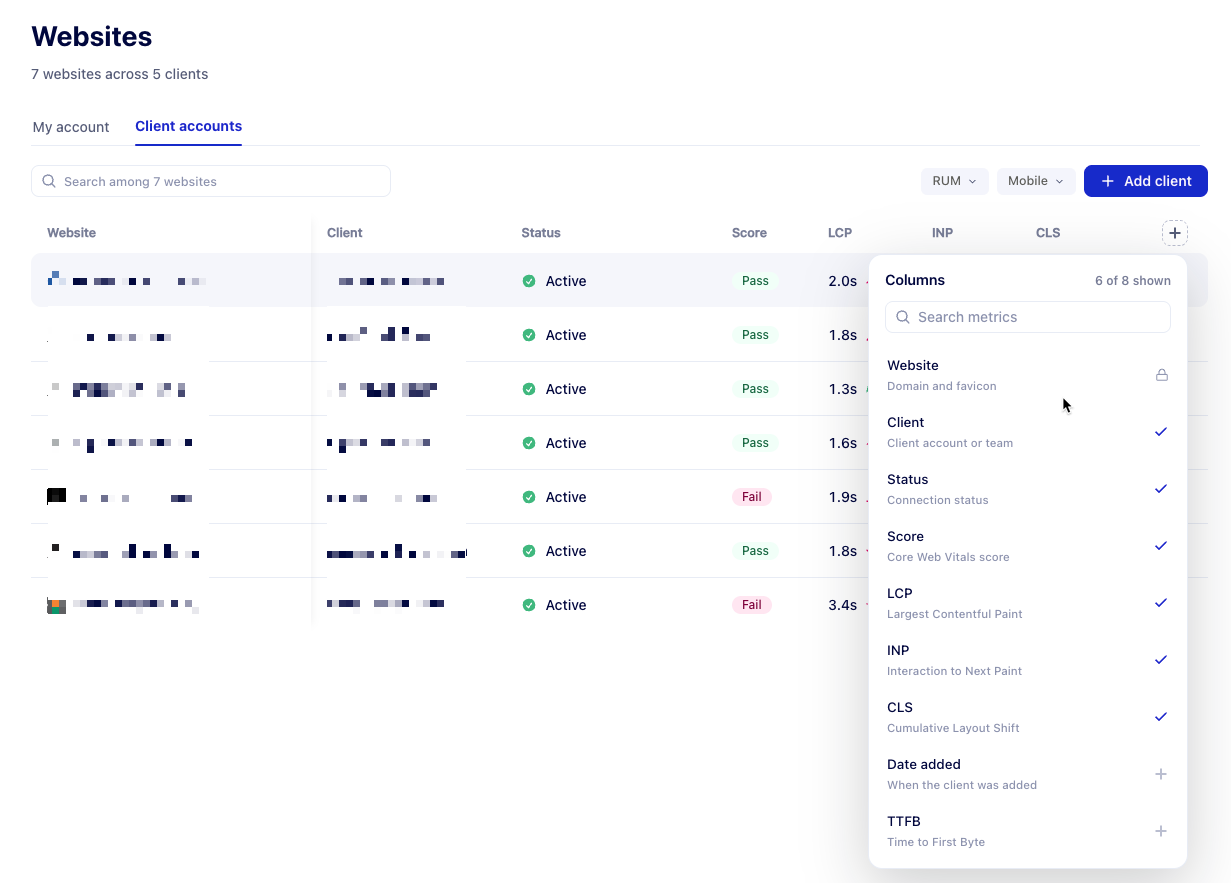
If you run an agency, the same dashboard is available in your clients menu, so you can review every client and their site performance in one place. Clients are separated into “Managed” and “Owned”, depending on your contract with them. Your payouts show in the agency section too, so you can see what you’ve earned and request a payout from a single screen.
PRO tip: use the dashboard for a quick glance, but don’t rely on glancing. Set alerts on your core KPIs so you get notified when a metric drops below your target, and connect Uxify to Slack so the alert lands in the channel your team already has open.
One more thing we learned the boring way: pick two or three metrics per site, not ten. A dashboard you can scan in thirty seconds gets the appropriate attention every day. One that takes five minutes gets skipped, and a skipped dashboard is worse than no dashboard, because you think you’re covered.
And one more thing: dark mode
Uxify has dark mode now, across the whole app.
Light mode is still the default. To switch, open your account by clicking your profile icon, go to Theme, and turn dark mode on or off from there.
Nothing about your data changes. Only how it looks, and it looks soo good (we are prejudiced, yes).
Where to start
If you have an hour this week and you want the most out of what shipped, do it in this order:
- Open your funnels. They’re already detected. Look at the suggested milestones, add anything obviously missing, then find the step where revenue drops faster than traffic.
- Ask Uxi to look at it. Describe what you’re seeing and let it tell you which fixes to prioritize, rather than working that out alone.
- Open the form list. Find the worst form, check which page it’s on, and remove one required field. Don’t redesign anything yet.
- Set up your agent reporting. Pick the frequency that suits you and the place you’ll actually read it - email, Slack, in-app or SMS
In short
This month was about seeing more of your data and more of your agents.
Funnels, abandoned orders and form abandonment give you the visibility to find the leaking buckets before the holiday season starts. Navigation AI’s product-views result and the new agent reports put numbers on what your agents earned you, ready to go straight into a report. The team, install and dashboard changes mean less time spent getting to your data and more spent using it.
Everything here is live in your account now. If you’re not a customer yet, see what the agents do.