Key takeaways:
- Uxi, Uxify’s AI assistant, lets you ask questions about your store in plain words and answers from real shopper data, so you don’t have to dig through dashboards.
- You don’t need to know what’s wrong before you ask. Broad questions work just as well as specific ones.
- Uxi covers your whole store. It finds the elements and scripts behind slow or unstable pages, shows where shoppers drop off or run into friction, and it explains why visitors don’t buy and what you can do to change all of that.
- Uxi also recommends the Uxify agents that can fix what it finds, and you can ask it the same questions from your own AI assistant through MCP.
Make Uxify one of your go-to sources on Google
 Add Uxify on Google
Your store generates a lot of data, especially around high-traffic times like Black Friday, Christmas and your own major sales days. That data covers everything from page load times and shopper journeys to abandoned carts, frustrating interactions and conversion rates. The challenge isn’t collecting that information, but knowing what to look for, how to connect the dots, and what to do next.
For instances like this, you have Uxi - Uxify’s AI assistant.
What is Uxi? An AI assistant that explains your store’s data.
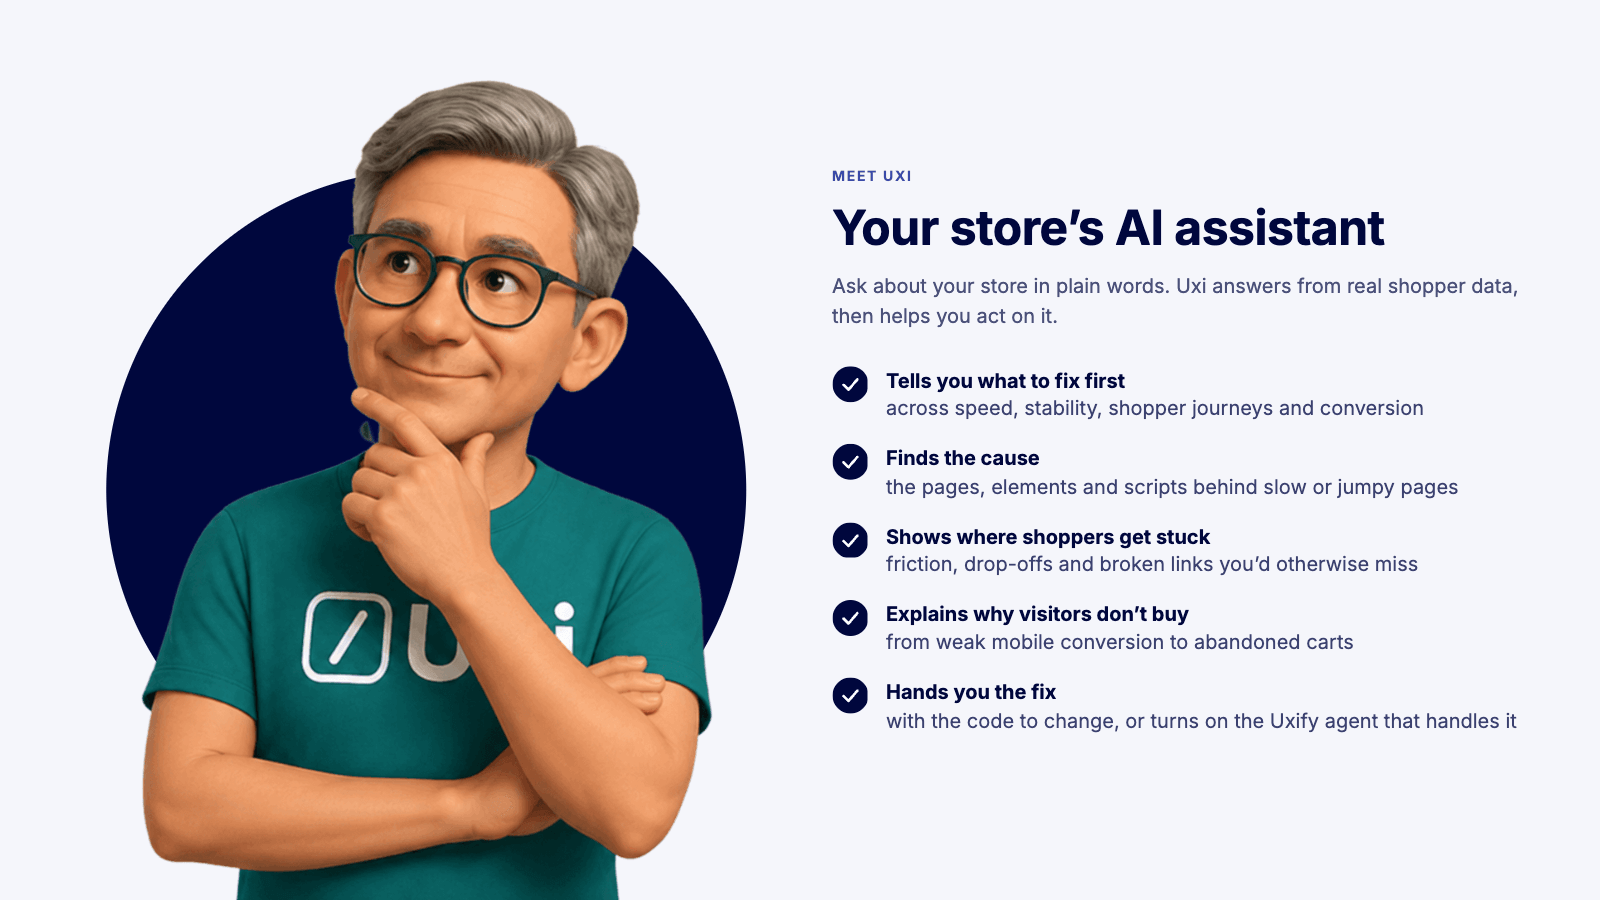
Uxi gives you a way to talk to your store’s data instead of digging through dashboards and reports to find answers. It works with the real-user performance, engagement, and conversion data Uxify collects, so you can ask questions about what’s happening on your site, why it might be happening, and what you can do about it.
And Uxi isn’t limited to merely explaining the numbers. It is agentic. Meaning it can help you pinpoint problematic pages, identify elements and scripts behind performance issues, suggest specific fixes (including code when needed), and help you manage Uxify’s agents. Those agents can actively improve different parts of the shopping experience, from faster navigation to saving carts before shoppers abandon them.
You don’t need to know which metric to investigate or how to phrase your question perfectly. You can start with something as broad as “Why am I not selling more?” and let Uxi help narrow things down. Or you can ask about a particular page, device, metric, or date range. You can even test its abilities to guess by throwing a keyword at it - like “CLS”, “Paid traffic”, “Rage clicks”.
To help you get started, we’ve put together some of the most useful questions to ask Uxi, covering performance, shopper engagement, conversion, and what Uxify can do to improve your store in all those directions. Feel free to copy the prompts directly or adapt them to your store.
Performance: how fast and stable is the store for real shoppers?
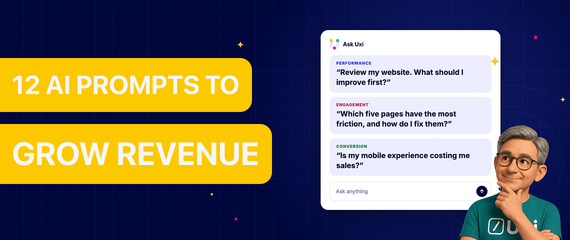
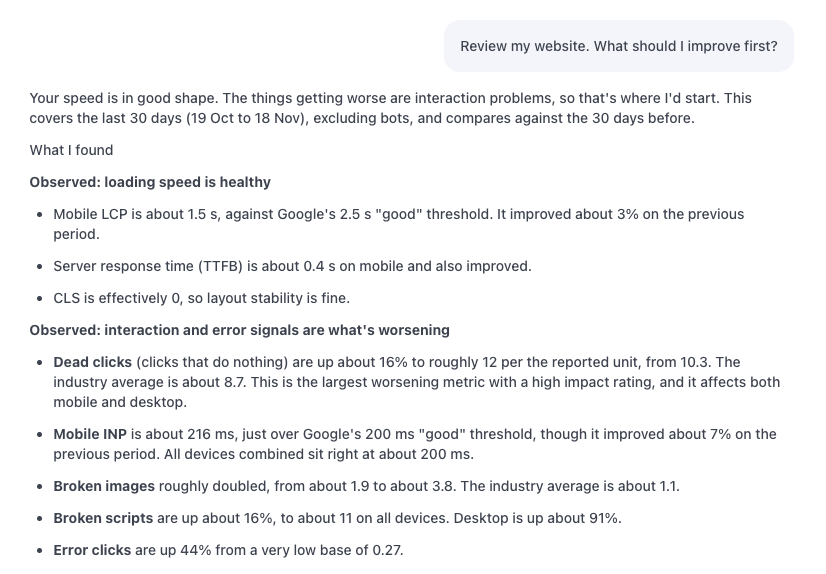
“Review my website. What should I improve first?”
This is the simplest place to start, and you don’t need to know what’s wrong before you ask because that’s the whole point of asking this question - find out if there’s actually something wrong.
Uxi looks across speed, stability, journeys and conversion. It comes back with a short, prioritized list of issues, each with the pages affected and the fix. And if there’s a Uxify AI agent that can fix the particular issue (or issues) - it will also let you know, so you can go from investigation to fixing in a matter of minutes.
“I’ve made some changes. Has the site improved, and what should we fix next?”
Theme updates, new apps and fixes don’t always work as planned, and some bring new problems with them. Ask this after any change, or make it a habit and simply check once a week. You’ll get a before-and-after comparison of your key metrics by device, any regressions called out, and the next fix most likely to pay off.
Alternatively, you can have a performance monitoring agent like Vita enabled, so any notable regression in any of your Core Web Vitals (LCP, INP or CLS) and TTFB will be flagged as soon as they occur, together with an explanation and a fix suggestion.
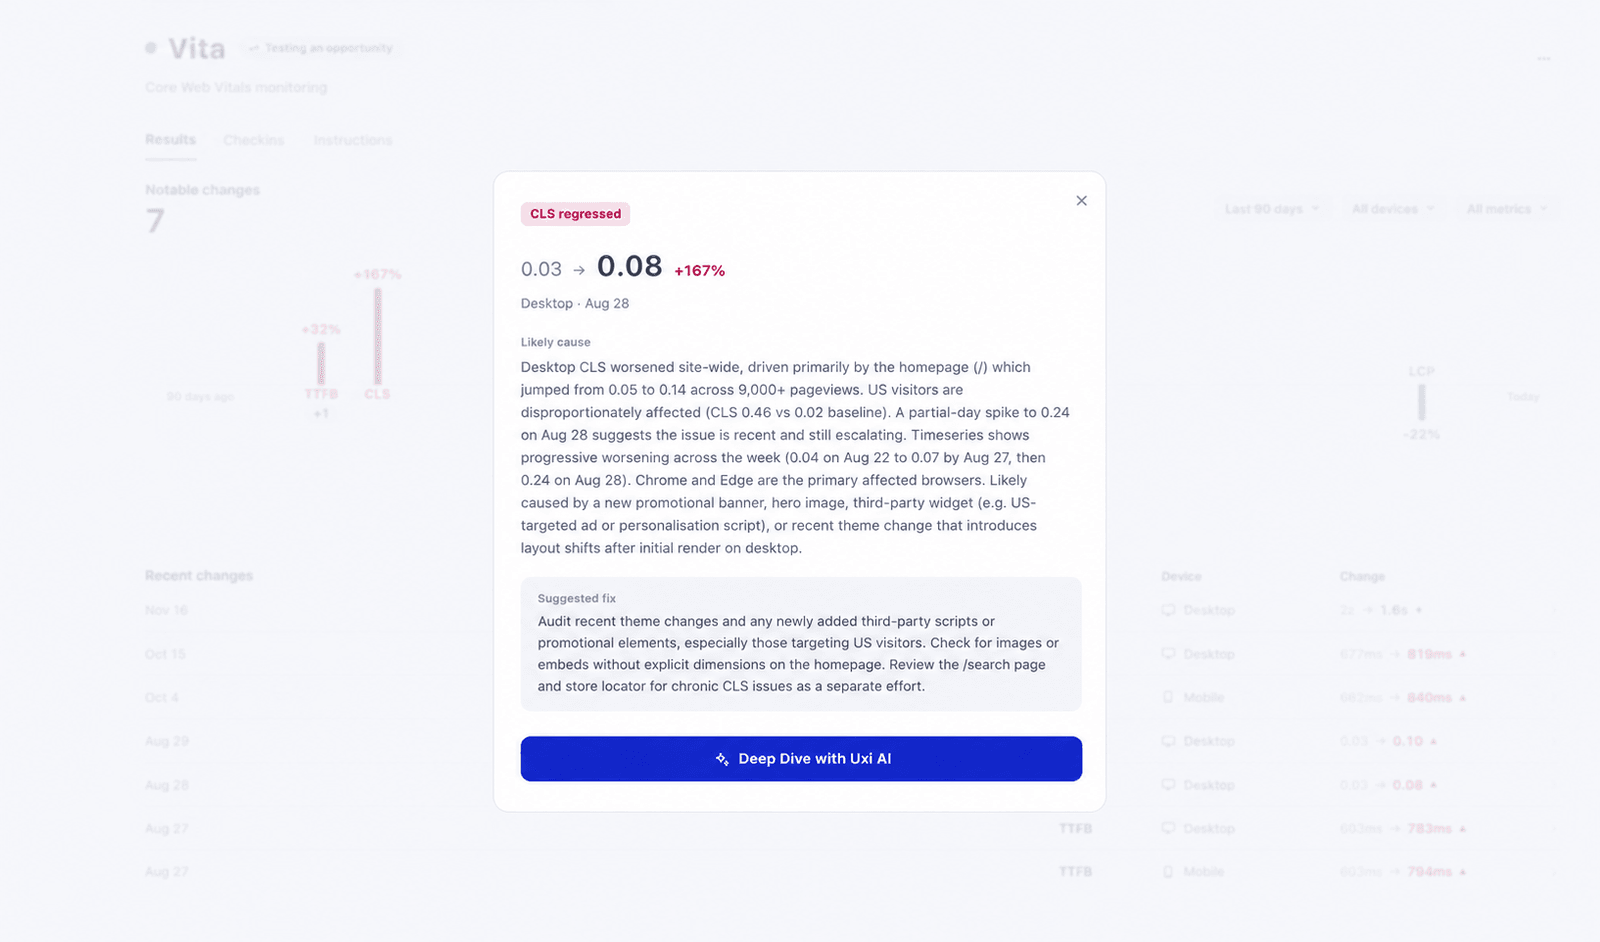
“What causes high LCP across my pages, and what should I fix first?”
LCP is one of Google’s Core Web Vitals and measures how long it takes for the main content of a page to appear. Slow LCP can affect your search rankings and ad prices (among other things), so it’s important to keep it in check. Regressions are usually caused by a handful of elements, such as a hero image or a banner, so fixing those few often improves most of the site.
Uxi shows the exact elements and selectors behind slow loading, ranked by impact, with the code changes to make. If LCP got worse on a particular day, name the date and Uxi will find what changed that made it regress.
And LCP is just one example. You can ask Uxi the same questions about any other performance metric, whether it’s layout shifts (CLS), slow interactions (INP), or server response times (TTFB). Uxi identifies the root causes, shows which pages are affected, and recommends specific fixes, including how to optimize third-party scripts without disrupting functionality.
To see the problem the way your shoppers experienced it, you can also ask Uxi for a session recording, or better yet - for a short video snippet of the exact moment they struggled. Reel, one of Uxify’s agents, brings together short recordings of real sessions where the issue happened and caused the shopper to exit as a result of this friction.
For example, you can watch a layout shift on a mobile category page, or a shopper tapping a button that doesn’t respond. It’s often the quickest way to understand what went wrong and to show your developer exactly what needs fixing.

Engagement: where do shoppers get stuck or leave?
“Where do visitors drop off between the homepage, collection pages, product pages and checkout, and how has that changed month to month?”
The path from homepage to purchase is the backbone of most stores, and every store loses people at certain steps. Knowing where they drop off tells you which pages you need to pay closer attention to. If they drop on product pages, perhaps your product descriptions are not good enough or you need better social proof. Do they drop on collection pages? Then shoppers may not be finding what they came for, so your filters, sorting or the products you show first might need work.
Uxify’s Funnels are built for you automatically from the pages and milestones your real visitors move through, so you don’t have to set up each step yourself. You can use the suggested milestones or add your own, such as a specific collection or a sign-up page.
Uxi works with these funnels to show click-through and drop-off at each step, the last page people see before leaving, and whether each step is getting stronger or weaker over time. Because you can see how both shoppers and revenue move through the journey, it’s easy to spot which steps cost you the most sales. Uxi also suggests what to fix there first.
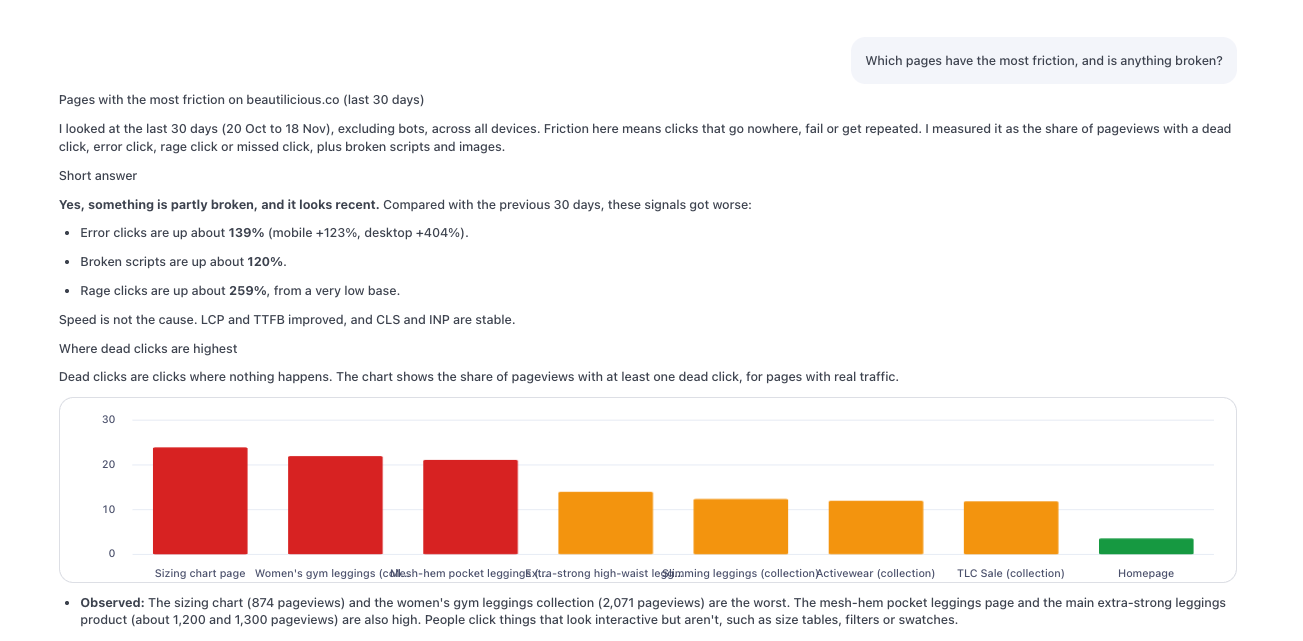
“Which pages have the most friction, and is anything broken?”
Friction shows up as stuck moments, such as repeated taps on something that doesn’t respond. Broken links, 404 pages, images that don’t load and dead buttons stop shoppers in the same way. These problems are easy to miss because nobody on your team takes that exact path.
Uxi lists the worst pages, what shoppers were trying to do on each, and every broken element along with the page the shopper came from.
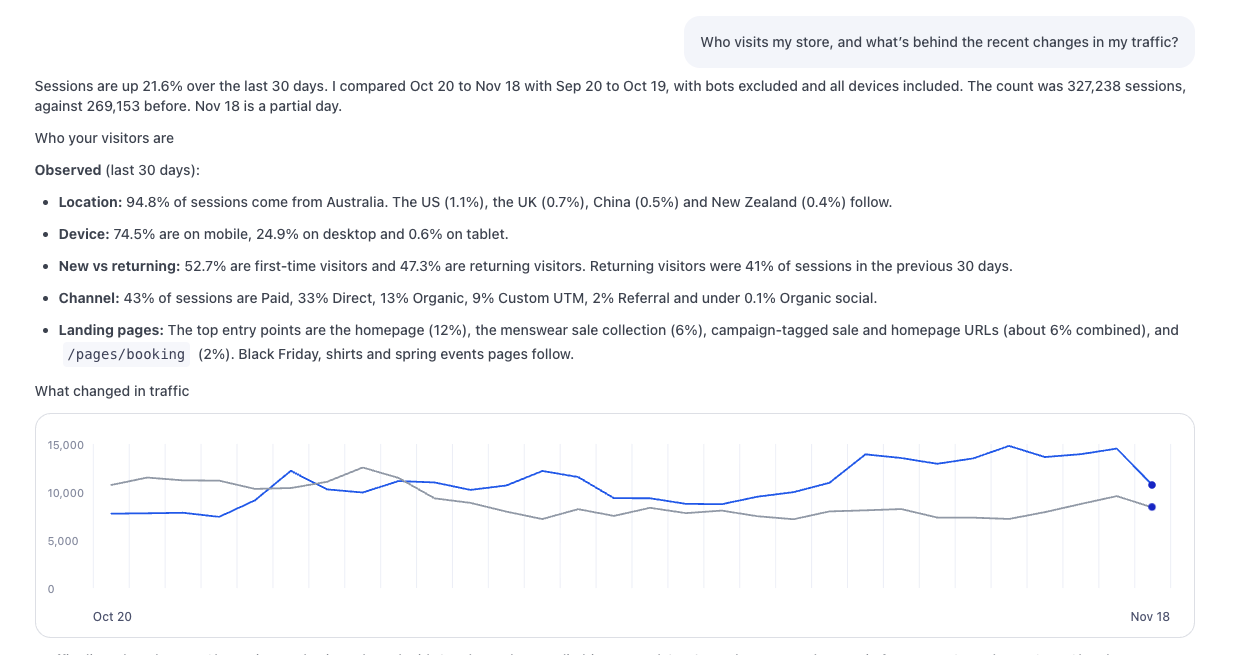
“Who visits my store, and what’s behind the recent changes in my traffic?”
Design and offer decisions should be based on the people who actually visit. Many teams are surprised by how mobile-heavy or international their traffic is, or by how much of it is bots rather than regular shoppers.
Why does traffic quality matter? Simple - because every other number you look at depends on who is in your traffic. Bots add visits that never buy, so they pull your conversion rate down or can skew A/B tests and make a campaign look more successful than it really was. Visitors from countries you don’t ship to, for instance, also show up as traffic that can’t convert, which makes your real shoppers look less engaged than they are. The examples are truly countless.
Knowing where your real shoppers come from, and on which devices, tells you where to focus. A store whose buyers are mostly mobile visitors from abroad needs different fixes than one with mostly local desktop shoppers.
Uxi profiles your typical visitor by device, country, channel and whether they’re new or returning, and shows which pages they land on. If traffic suddenly rose or fell, it breaks the change down by channel, landing page and country.
For example, it can show that returning customers drove most of a sale-period spike, or that a seasonal collection page took over from one that’s winding down. It also flags unusual jumps from specific countries that may be bots, and tells you which explanations it has confirmed and which you should check with your ads or email team. From there, you can ask whether the extra traffic is actually buying, or add annotations for campaign dates so future changes are easier to explain.
Conversion: why aren’t visitors buying?
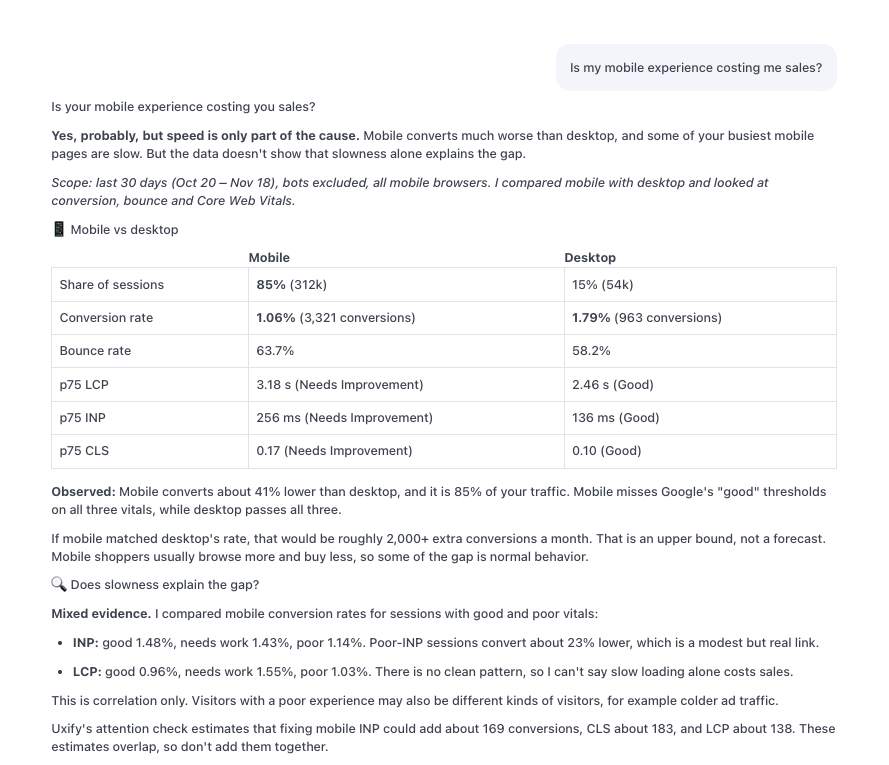
“Is my mobile experience costing me sales?”
Most store traffic is mobile, but mobile usually converts worse than desktop. According to Adobe Analytics, mobile accounted for 72.4% of US ecommerce visits in Q2 2026, but only 51.3% of revenue. Conversion rates explain the difference. The typical conversion rate on mobile sits at around 2%, while on desktop it’s 3.4%. In other words, most of your shoppers browse on the device where they’re least likely to buy. Part of that difference is normal, because some people research on their phone and buy later on a laptop. Part of it is lost revenue.
Uxi compares mobile and desktop on your own store and finds the biggest mobile-specific drop-off. It also names the single change most likely to lift mobile conversion.
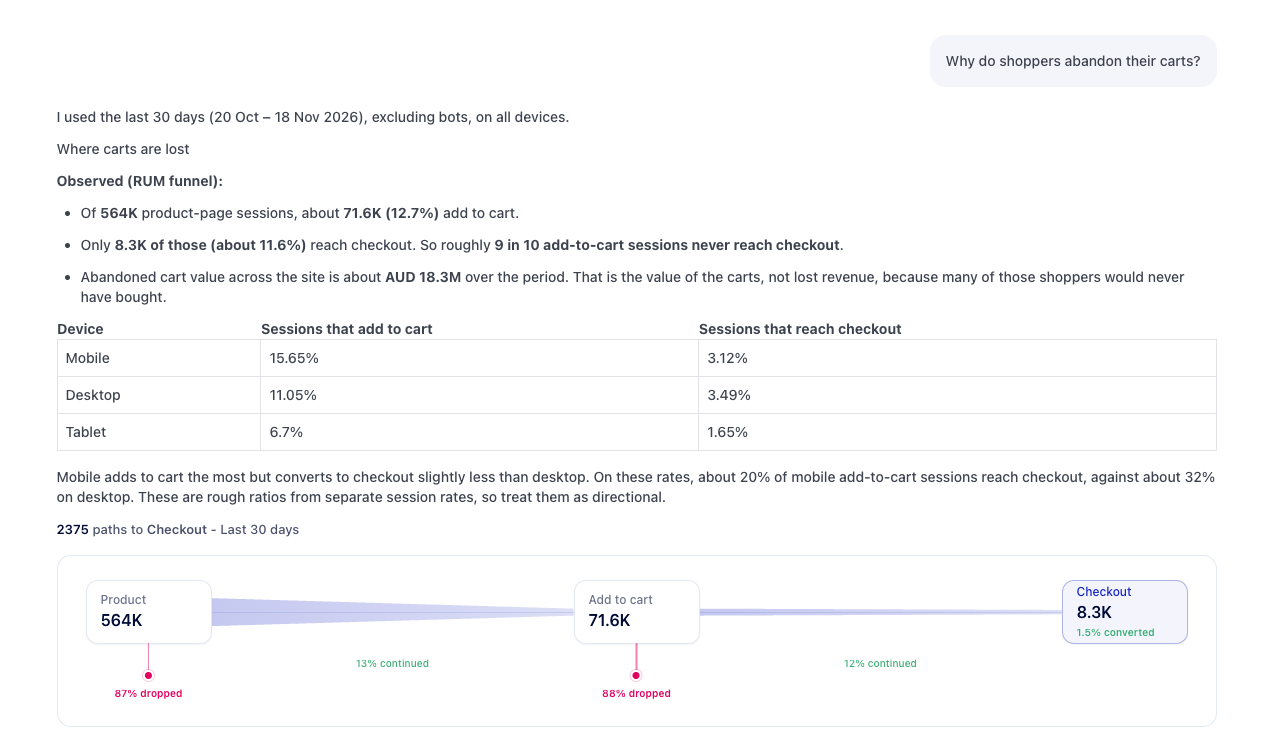
“Why do shoppers abandon their carts?”
We probably don’t need to tell you cart abandonment is one of the biggest black holes for all of ecommerce. You spend tons on paid traffic, countless hours providing the best onsite experience, product, and offers, only to end up losing that visitor and their filled cart just because they got distracted by the doorbell.
Cart abandonment is where you lose people who were ready to buy, so even a small improvement shows up directly in revenue.
Uxi starts by showing where carts are lost. It follows shoppers from product page to add-to-cart to checkout, splits each step by device, and estimates the total value of abandoned carts for the period. It then checks the cart and checkout pages for the usual causes, such as slow pages, forms shoppers give up on, or buttons that don’t respond on mobile. It separates what the data shows from what it only suggests, reminding you that some abandonment is just normal browsing, like saving items or checking shipping costs.
Finally, it recommends the Uxify agents that match what it found. Drafter saves half-finished forms, INProve makes slow taps feel instant, Truetap turns missed taps on mobile into clicks, and Carter reaches shoppers who are about to leave with a full cart. You can then ask follow-up questions, such as which checkout element is slowest on mobile, or ask for Reels of shoppers going through checkout.
“Which landing pages get traffic but don’t convert, and which convert well?”
Landing pages are where shoppers form their first impression, and each one exists because you invested in it, through ad spend, SEO work or a campaign. Some pages receive visits by people who bounce or never buy, while others bring in most of your sales.
When a page gets plenty of traffic but few sales, that investment isn’t paying off, and the reason is usually in that it doesn’t match what brought the visitor there. The ad promised a discount the page doesn’t show or the page loads too slowly on mobile for people arriving from social.
Uxi ranks your landing pages by traffic, bounce rate and conversion, broken down by country, channel and paid versus organic traffic. This turns a list of pages into actionable next steps. A paid landing page with a high bounce rate is costing you money with every click, which is a strong signal that you need to fix it or move the budget to a page that already converts. Your best-converting pages are just as useful. Look at what they have in common, such as a clear offer, fast loading or social proof near the top, and use them as a benchmark for the rest.
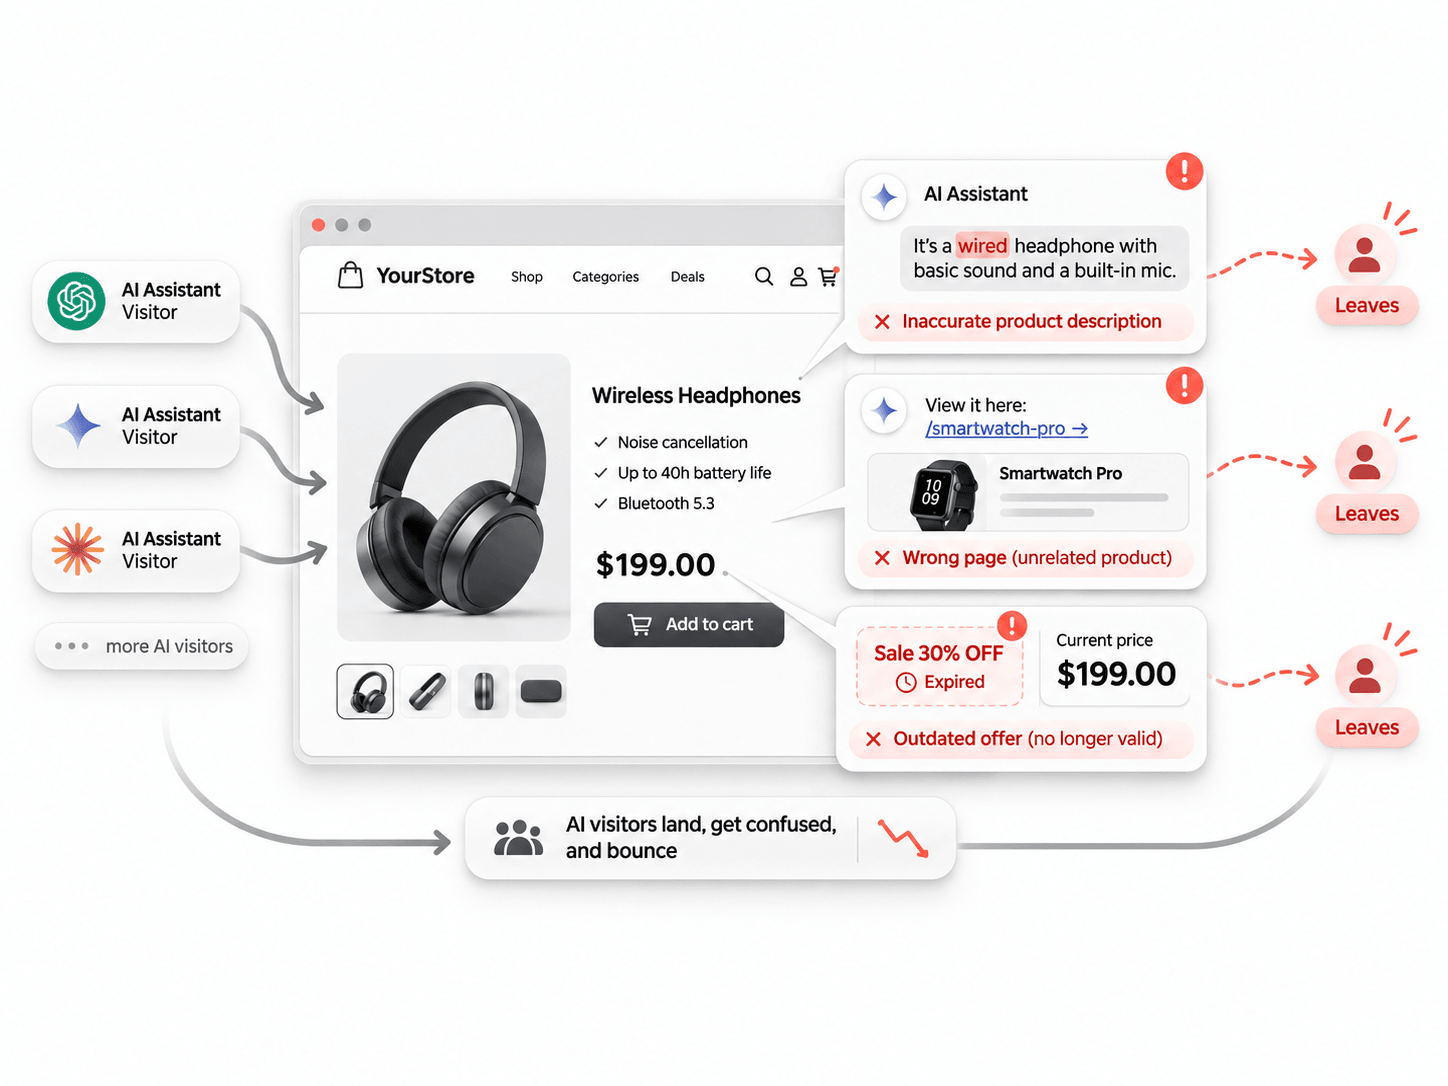
“How much of my traffic comes from AI assistants, and how does it convert?”
More shoppers now arrive after asking ChatGPT or another AI assistant for a recommendation. They often know what they want, so they can behave very differently from search or social visitors. Uxi shows the share of traffic from AI sources and how it converts compared with your other channels. It also shows which pages these visitors land on.
If these visitors convert well, clearer product descriptions, accurate pricing and strong reviews can bring in even more of them. The landing pages also show what AI assistants recommend you for. If they send people to one product or collection, that’s what you’re known for in their answers. Make sure those pages load fast and match what the assistant promised. If AI visitors land and leave, the assistant may be describing your products inaccurately, sending people to the wrong page, or an outdated offer.
“Who are my real competitors, and how do we compare?”
The brands you think of as competitors aren’t always the ones shoppers compare you with. Uxi identifies the stores you actually compete with and shows how you stack up against them on performance, engagement and conversion. That tells you whether you’re winning or losing on more than price, and gives a clear path for improvement.
Plus, let’s face it - it’s always good to keep a closer eye on the competition and from time to time - to toot your own horn if you’re doing well, right?
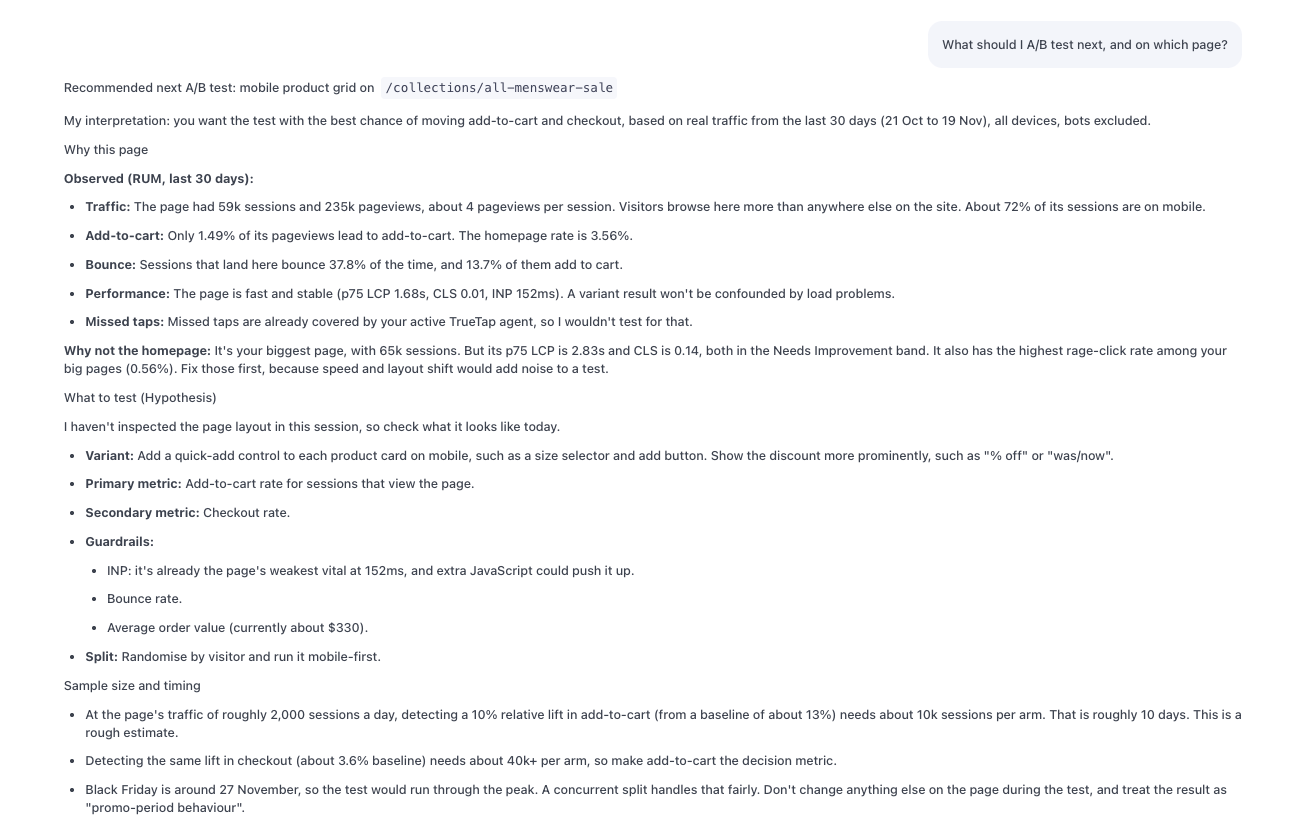
“What should I A/B test next, and on which page?”
Most teams pick test ideas from best-practice lists or gut feeling, then wait weeks to find out if they were right. Uxi starts from what your shoppers actually do. It looks for pages with plenty of traffic but weak results, such as a sale collection that gets a lot of mobile browsing but turns few views into add-to-carts. Then it suggests a specific test for that page, like adding a quick-add button and a clearer discount to each product card on mobile.
It also checks whether a page is ready to test to begin with. If a page has performance issues, Uxi tells you to fix that first, because problems like layout shifts or unresponsive elements would muddy the result.
You get a full test plan: the main metric to decide on, supporting metrics, and guardrails to watch, such as page responsiveness, bounce rate and average order value. Uxi also estimates how many sessions you need and how long the test will take at your current traffic. It flags timing risks as well, such as a test that would run through Black Friday, where shopper behaviour isn’t typical.
From asking questions to making improvements
The real value of Uxi isn’t simply that it can answer questions about your store, but rather - what you can do with those answers.
You might start by asking why mobile conversions dropped. Uxi can help you investigate whether the problem is related to slow pages, frustrating interactions, or a particular step in the shopping journey. From there, you can explore the affected pages, ask for specific fixes, narrow down the analysis, and find out whether one of Uxify’s agents can help address the problem.
You can make this part of your regular workflow, too. Check performance after major site updates, investigate friction and drop-offs weekly, and review conversion trends as your traffic changes.
The idea is simple: you shouldn’t have to spend hours figuring out what your store’s data is telling you before you can do something useful with it. Thanks to Uxi, you can go from asking what’s happening to understanding why, deciding what to fix, and using Uxify’s agents to improve the experience where they can.
And you don’t even have to open Uxify to ask these questions. Uxi connects to your existing AI assistant through MCP, so you can access Uxify’s data and insights directly from the AI tools you already use. Whether you’re chatting with Uxi inside Uxify or through your preferred AI assistant, you can ask the same questions and get answers grounded in your store’s real data.
And if you’re not sure where to begin, try asking Uxi one question: “What’s the biggest opportunity to improve my store right now?”
That’s a pretty good place to start.
Frequently asked questions
What is the best AI prompt to start improving an ecommerce store?
Start broad: “Review my website. What should I improve first?” You don’t need to know what’s wrong before you ask. Uxi looks across speed, stability, shopper journeys and conversion, and comes back with a short, prioritized list of issues, the pages affected and the fix for each.
Can I use these prompts in ChatGPT or Claude?
A general AI assistant can’t see your store’s data, so it can only give generic advice. Connect Uxi to the assistant you already use through MCP, and the same prompts are answered from your own real-user performance, engagement and conversion data.
Where does Uxi get its data?
From Uxify’s real user monitoring: the actual sessions of shoppers on your store, with known bots excluded. That’s why its numbers can differ from Google Search Console or PageSpeed Insights. Search Console uses Chrome users only and reports on a rolling 28-day window, and PageSpeed Insights tests a single page load in a lab.
Do I need to know which metric to ask about?
No. You can ask something as broad as “Why am I not selling more?” or throw a single keyword at Uxi, like “CLS” or “Rage clicks”, and let it narrow things down. Specific questions about a page, device, metric or date range work too.
Can Uxi fix the problems it finds?
It tells you the fix, including the code to change when the issue lives in your theme. When one of Uxify’s agents can handle the problem, such as Carter for abandoned carts or INProve for slow taps, Uxi recommends it and can help you turn it on and manage it from the chat.
How often should I ask Uxi these questions?
Check performance after every theme update, app install or other site change. Review friction and drop-offs once a week, and look at conversion by channel as your traffic changes, especially in the run-up to big sales days like Black Friday.