
Key takeaways:
- Shopify themes range from 43.8% to 97.2% of their stores passing mobile Core Web Vitals - more than fifty percentage points of spread inside the same theme store.
- The ten most-installed themes average around 86% on mobile, roughly ten points below what the best themes have been delivering the whole time.
- Loading is improving across the platform while interaction is getting worse: median mobile INP pass rate fell from 95.7% to 93.3% in six months, driven by what stores install rather than by the themes themselves.
- Judge a theme on five numbers - mobile pass rate (aim 90%+), INP (95%+), the mobile-to-desktop gap (within 5 points), CLS (97%+), and your own store's mobile LCP measured on real visitors.
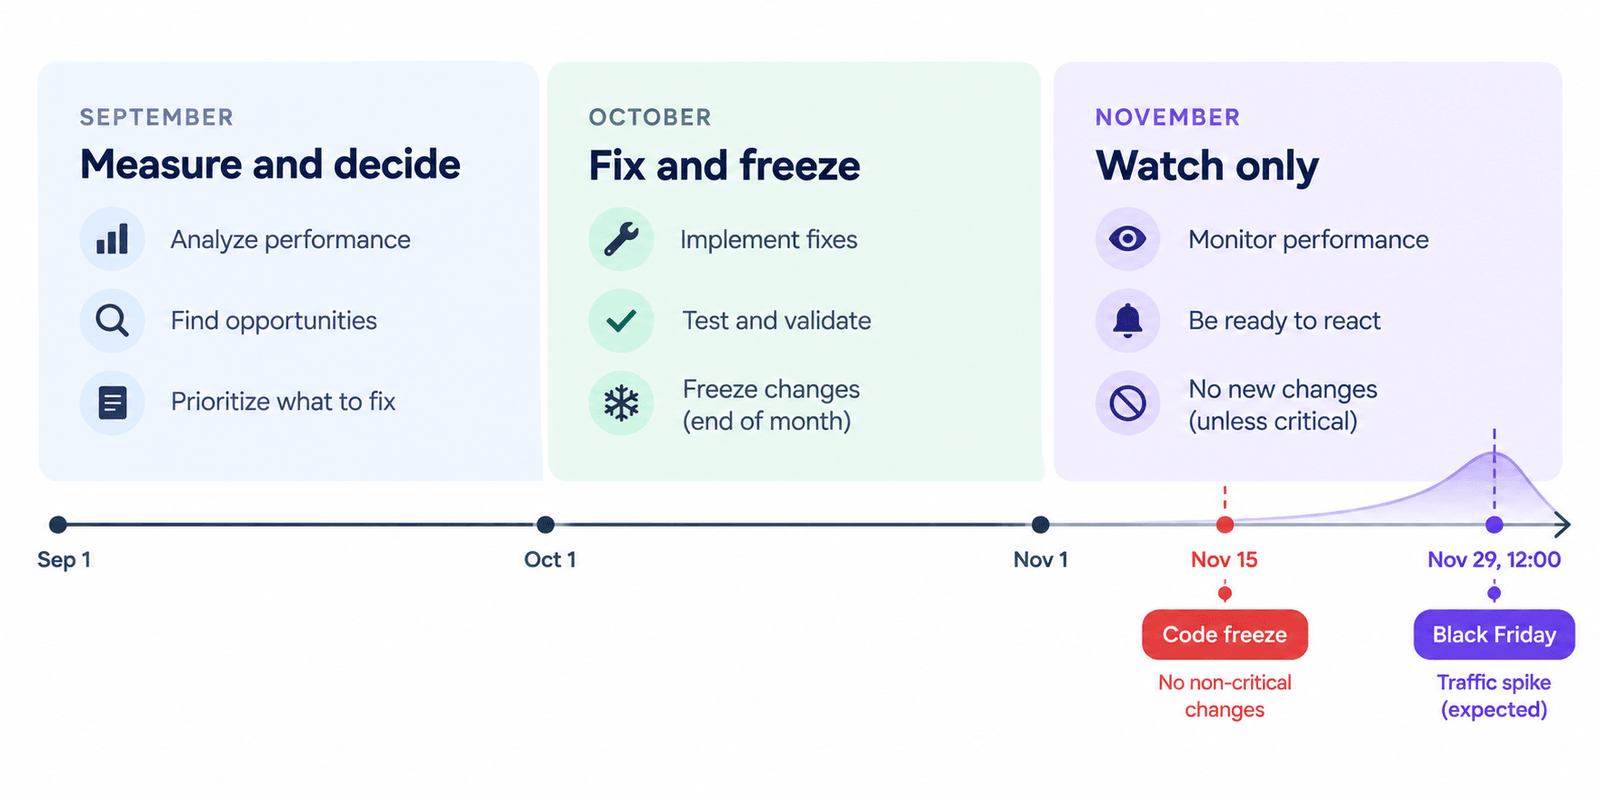
- More than eight weeks out, a theme change is on the table. Inside eight weeks, triage instead: cull unused apps, resize hero images, fix loading priority, and freeze everything by mid-November.
Make Uxify one of your go-to sources on Google
 Add Uxify on Google
At 12:01 p.m. ET on Black Friday last year, Shopify merchants were selling $5.1 million worth of products every sixty seconds. That was the peak of a weekend that closed at $14.6 billion, up 27% on the year before, with more than 94,900 stores posting the best sales day they had ever had.
But the part you won’t read in a polished press release is that those 94,900 stores were not the only ones who spent months building up to that minute. Plenty of merchants caught the same traffic wave and turned less of it into money, and most of them never found out why. They looked at the ad spend. They looked at the discount depth, the email sequence, the landing page copy. They did not look at the thing sitting underneath all of it.
Your theme is the ceiling on your BFCM. Every dollar of paid traffic, every SMS blast, every influencer code gets filtered through it before it reaches your checkout. So the cost of having a slow theme compounds, affecting every single activity on your site.
That is also why it almost never gets blamed. A broken discount code throws an error. A failed email send shows up in a dashboard by Saturday morning. A theme that is half a second too slow on mobile just hands you a slightly worse conversion rate on every channel at the same time, spread thin enough that no single report looks wrong. You can finish the weekend up on last year and still never learn what that ceiling cost you.
The good news is - it’s still not too late to audit and improve your theme, but you need to hurry because October is just around the corner.

Your theme sets the starting line
Every theme comes with its own technical debt, and you inherit it the day you install it. Someone else already decided how the code is structured, how much JavaScript ships on every page, and how much work a phone has to do before a customer can tap anything. Choosing different fonts and colours does not change any of that.
What that debt costs you depends on how well the theme was designed and built. A good one has room to spare: add a review widget, a cart upsell, a currency switcher and an email popup, and the store still feels quick when traffic lands. A poorly built one is close to its limit before you touch it. Install a single widget and the page starts to stall. Someone taps add to cart, nothing happens for a moment, they tap again, and the flow they were in breaks at the exact point where it was about to make you money.
Theme Vitals, which tracks real Shopify stores rather than demo sites, puts it simply: a poor-performing theme only gets worse as you add apps and tag managers, while a fast one leaves room for the tools you actually want.
None of this is visible in a theme store preview. Two themes can look identical on the demo and behave nothing alike once real merchants load them up with products, apps and traffic. The only honest way to tell them apart is to look at how each one performs on the stores already running it, which is what Theme Vitals was built to do. It comes from Sia Karamalegos, a web performance engineer who spent two years at Shopify working on store speed, and it is free to check.
What the theme data actually shows
Theme Vitals publishes, for every theme in the Shopify theme store with enough live stores behind it, the share of real stores where at least 75% of visits pass all three Core Web Vitals. Not a lab test on a demo site. Real Chrome sessions, on real phones, on real networks, across more than 630,000 Shopify stores. We used the same source when we ranked the fastest Shopify themes last year, and the picture has only got more interesting since.
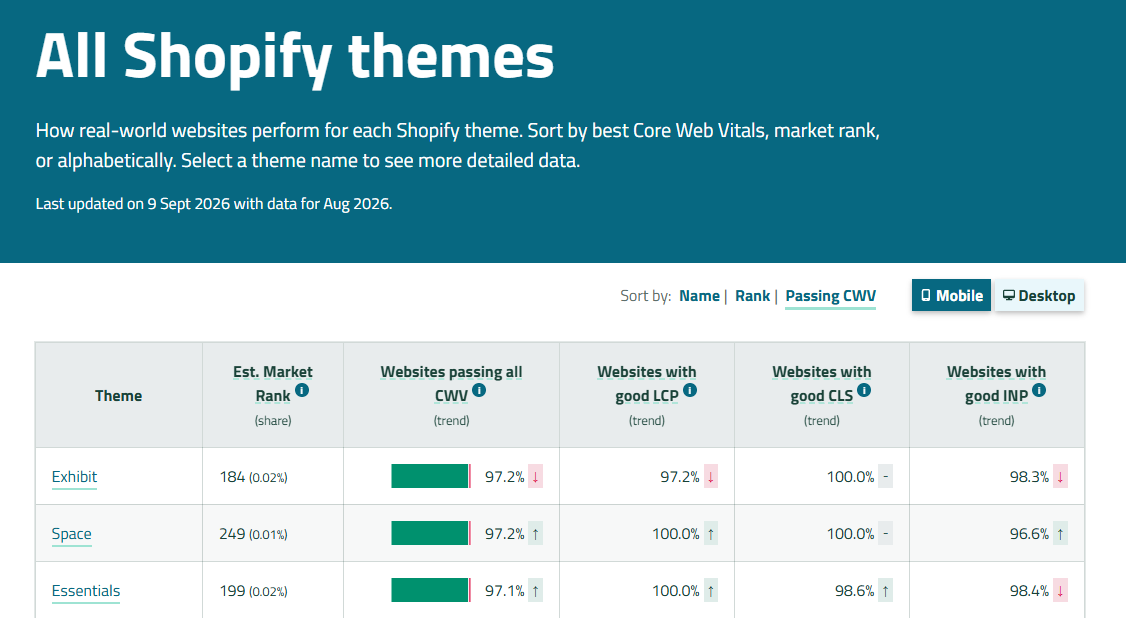
Source (Theme Vitals)
Three things stand out in the latest data, published in September for the month of August.
1. The spread is enormous. The median theme passes on 84.8% of its stores on mobile. The best sits at 97.2%. The weakest with enough stores to report sits at 43.8%. That is more than fifty percentage points of difference inside the same theme store, sold in the same place, to the same merchants, with much the same feature lists.
Those are the most performant themes on mobile:
| Theme | Mobile pass rate |
|---|---|
| Exhibit | 97.2% |
| Space | 97.2% |
| Essentials | 97.1% |
| Baseline | 96.9% |
| Taiga | 96.7% |
| Tailor | 96.6% |
Worth a look if a redesign is anywhere on your roadmap.
2. The popular themes are not the fast ones. The ten themes running the most Shopify stores average around 86% mobile pass rate. The best themes reach 97%. So the crowd is sitting roughly ten points below what has been available the whole time, in the same theme store, at the same kind of price.
Ten points sounds small until you watch it happen. It is the difference between a page that feels instant and a page that feels like it is thinking about it.
3. Interaction speed is drifting the wrong way. This is the one we did not expect. Over the last six months, median mobile loading performance across themes has crept up, from 93.3% to 94.1% passing LCP. Over exactly the same period, median mobile interaction performance fell from 95.7% to 93.3% passing INP, and more themes got worse than better last month.
Loading is being solved by better defaults and better image pipelines. Responsiveness is not, because responsiveness depends on what gets installed on top of the theme, and on what those scripts decide to do next.
That second part is the one merchants never see coming. Erwin Hofman, who monitors Core Web Vitals across a large pool of live sites, flagged the Meta Pixel in August: its script execution time climbed from roughly 48ms in April to roughly 73ms by the second half of August, which his data traces to a document-level click listener doing heavier work on every interaction. Nobody on those stores installed anything. The script simply got heavier underneath them. And Google calls an interaction good under 200ms, so one third-party script taking 73ms leaves under 130ms for your theme, your other apps and the actual work of responding to the tap. If you run Meta ads, that script is on your product pages today, in the season you lean on it hardest. It is also why INP has become the metric to watch heading into BFCM.
The five numbers to judge a theme on
1. Mobile pass rate for all Core Web Vitals
Aim for 90% or higher. Below 85%, keep looking.
This is the headline number, and the closest thing to a single verdict you will find. It answers one question: of all the real stores running this theme, how many are giving most of their visitors a good experience?
Use the mobile figure rather than desktop. Mobile is where the constraints bite, and it is where themes actually struggle: median mobile INP pass rate across themes is 93.3%, against 99.8% on desktop.
Seasonal traffic leans harder that way too, and not by accident. Your BFCM promotion runs through channels that are phone-first by nature. An SMS blast is read on a phone. So is the email that lands at 6am, the Instagram story, the TikTok ad, the push notification. You spend November driving people to your store through the most mobile-heavy channels you have, which means the mix arriving that weekend is more mobile than your normal traffic, and you can see that in your own analytics before you take my word for it. All the more reason to judge mobile performance on its own terms.
The reason to hold out for 90% rather than settling for above average is headroom for your toolset. The median theme sits at 84.8%, so buying the median means you are starting the season with already shaky performance before you install anything.
2. The INP pass rate
Aim for 95% or higher.
Interaction to Next Paint measures how quickly the page responds when someone taps. Add to cart. Change the size. Open the cart. Filter the collection. On BFCM that is more or less the whole customer journey, performed at speed by people holding a discount code.
This is the number that tells you how many apps you can afford. Shopify’s own developer guidance is clear on the mechanism: JavaScript, whether from your theme or from the apps you install, competes with the browser’s ability to render the page and respond to input, and too much of it in the wrong place is a primary cause of poor INP.
The revenue side is just as clear. Shopify found that for every 32 milliseconds slower a store responds to interactions, conversion tends to drop by around 1.5%. And when the travel booking site redBus made responsiveness a dedicated project, they measured roughly 7% more sales.
It is also where the most expensive failures hide, because they are invisible in a screenshot. The weakest theme on mobile INP in the August data sits at 46.3%, while median loading performance across all themes is above 94%. Some themes arrive quickly and then feel broken in the hand. Shoppers do not describe that as poor Interaction to Next Paint. They describe it as janky and then they leave the page and go back to Instagram.
So look at loading and interaction separately.
3. The mobile-to-desktop gap
Aim for a gap within 5 points.
Sort the same table two ways and you learn something no theme marketing page will tell you. Some themes are well engineered on both sides: Baseline at 96.9% mobile and 97.7% desktop, Taiga at 96.7% and 96.5%. Others look wonderful on the demo your designer showed you on a 27-inch monitor and come apart on a phone.
A wide gap usually means the theme was built desktop-first and the mobile view is a squeeze of the same heavy layout rather than a design in its own right. Better to know that before you commit a season to it.
4. The CLS pass rate
Aim for 97% or higher.
Cumulative Layout Shift covers content that moves after it appears, and it matters more in November than at any other time of year. BFCM is when you bolt extra furniture onto your storefront: announcement bars, countdown timers, free shipping progress bars, spin-to-win popups, sticky discount strips.
A theme that is already shaky on layout stability will be genuinely unpleasant once all of that is in place. The failure mode costs real money too. A shopper reaches for add to cart, a late banner loads, the button moves, and they tap the wrong thing.
Like INP, this one hides behind a good loading score. Median mobile CLS pass rate is 96.2%, and the weakest theme in the August data sits at 52.3%. Those pages arrive quickly and then rearrange themselves while the customer is trying to use them.
5. Your own mobile LCP, on your own store
The official Google documentation states that the goal for LCP is a load in under 2.5s, but in reality for ecommerce the real threshold is 1.5s
The first four numbers value the performance of a theme in isolation. This one measures the actual performance of your store, with your images, your apps, your sections and your customisations.
Two things make it trustworthy. Measure with real visitors rather than a single lab run. And treat a green Lighthouse score with healthy suspicion. Theme Vitals leaves lab scores out of its rankings for a reason: they can be gamed, and there is a whole cottage industry of speed services that install a script to detect when a test is running and quietly skip work while it does. Plenty of stores have an excellent score while leaving their visitors waiting for basic pages to load.
What to look at beyond the scores
The five numbers get you to a shortlist. These are the things that separate two themes sitting on the same score.
1. How it handles images. Shopify’s image CDN will happily resize and convert on request, but only if the theme asks it to. You want images requested at sensible widths with a proper responsive set behind them, so a 390-pixel phone receives a 390-pixel image rather than the 2000-pixel version built for a desktop hero. Compression is still your job, though. Modern themes handle responsive delivery well and none of them can rescue a badly exported JPEG. DebugBear suggests keeping hero images under around 180KB, and notes they regularly find Shopify heroes several times heavier than that.
2. Whether it gets the loading order right. This is the most common performance miss on Shopify stores, and it is worth understanding even if you never open a Liquid file.
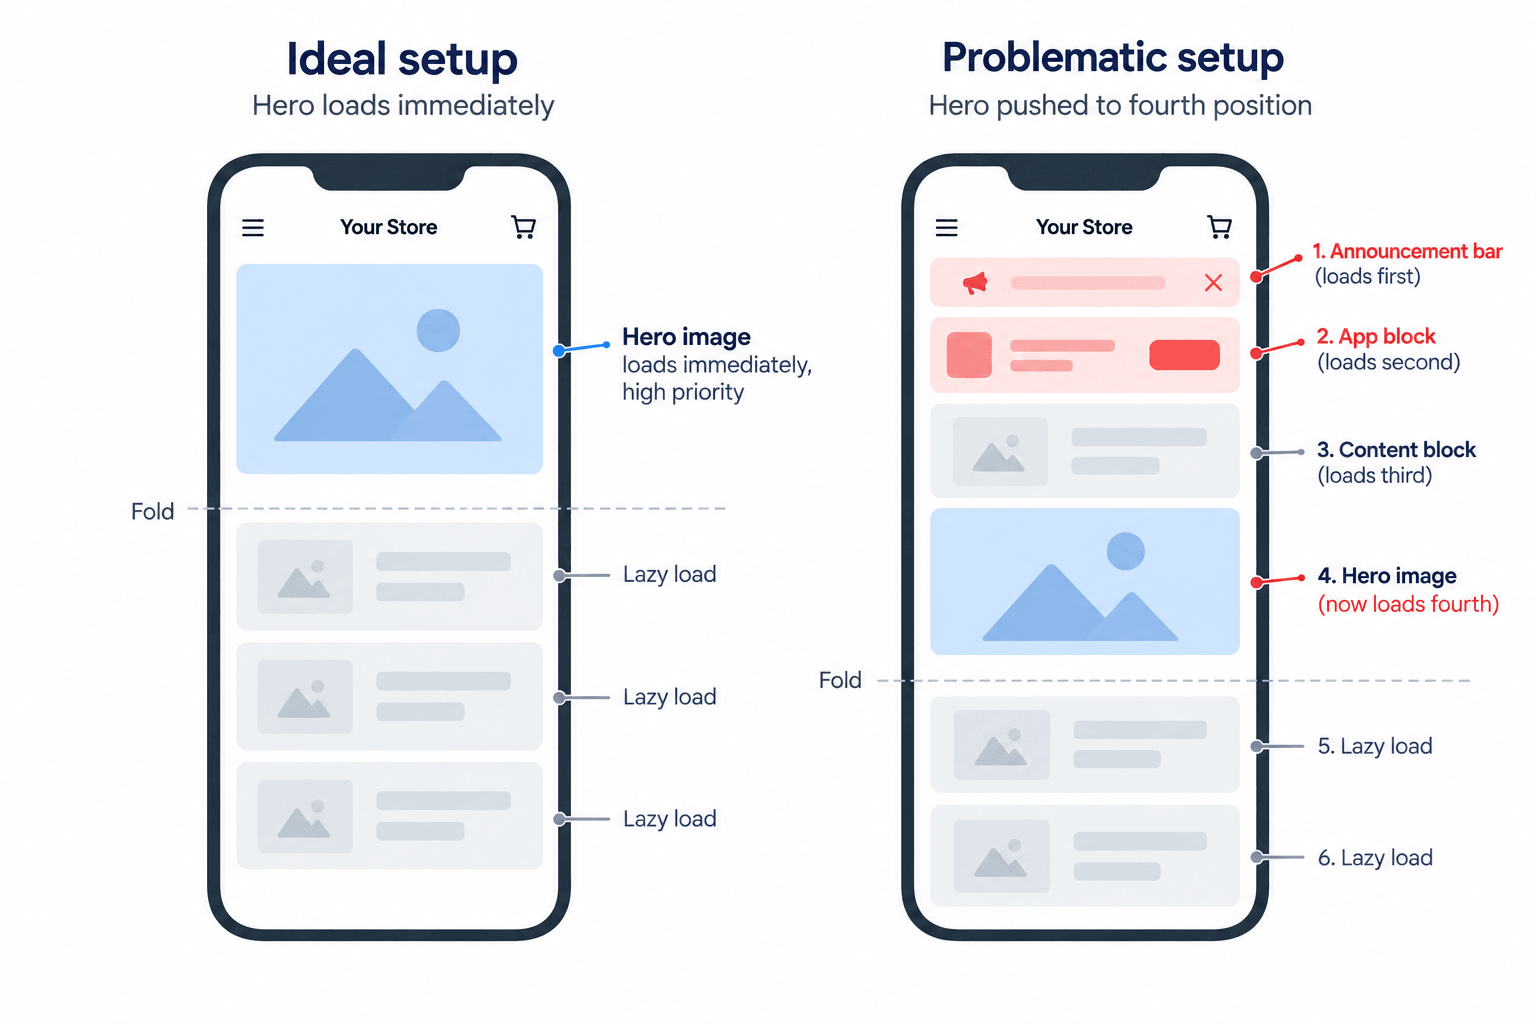
Shopify’s documented approach is position-aware. The first section on the page loads its main image immediately at high priority. The fourth section and later load lazily. Everything in between loads normally. Their guidance is specific: high fetch priority belongs on one image per page, it has to be the largest thing in the first screen, and it never gets combined with lazy loading. They also say it plainly elsewhere: never lazy-load your LCP image.
Here is where it catches merchants out. That logic depends on your hero genuinely being the first section. Drag your big promo banner to what looks like the top of the homepage, and it can still be the fourth section once you count an announcement bar, a sticky promo and an app block above it. The most important image on your store then gets treated as below-the-fold content and waits its turn. So even if you don’t have a technical background, go to Google’s Dev Tools AI and ask whether your main image is loaded with high priority or falls into the lazy-loaded section
While you are there, think about hero carousels. Three rotating full-width images means three large downloads competing at the exact moment you need one of them to arrive fast.
3. Whether it reserves space. Every image, embed and banner should declare its dimensions so the browser can hold the space before the content arrives. Shopify has a whole page on preventing image layout shift, and it is what stops your countdown timer from shoving your buy button down the screen.
To check: load a product page on your phone and watch the top of the screen as it fills in. If the price or the buy button jumps even once, something is not reserving its space.
4. How it feels in your hand. Open the demo store on your phone. Add to cart. Change a variant. Open the cart drawer. Filter a collection with plenty of products in it. Use the search. Count the beats between your tap and the screen doing something. Four minutes, and it will tell you more than any dashboard.
5. The update story. Once a theme’s code is customised, it stops updating automatically, and the developer’s own performance improvements stop arriving unless somebody merges them by hand. Ask how much customisation you are planning and who will maintain it. A theme two years behind its own release is a slow theme with a fast reputation.
6. How it behaves at scale. Your demo store has twelve products. Your collection page on Black Friday has three hundred, with filters, sold-out badges, price ranges and a sort dropdown. Test with a realistic catalogue before you decide rather than after.
So let’s talk about timeframes…
More than eight weeks out? A theme change is genuinely on the table. Check your shortlist against the five numbers, build on a duplicate, test with your real catalogue, and give yourself a launch date with a few weeks of monitoring after it.
Inside eight weeks? Please do not replatform. Triage instead, and you get most of the benefit anyway. The Shopify performance issues that cost merchants the most are usually the quickest to fix. Audit your installed apps and remove the ones nobody uses, because there is nearly always a graveyard at the bottom of that list still loading scripts on every page. Compress and correctly size the images on your top ten landing pages. Check that your homepage and collection heroes load immediately at high priority. Move tracking pixels behind a tag manager so they stop competing with your first paint. Our Shopify speed guide walks through all of it, and there are apps that handle parts of it for you if you would rather not touch code.
If you look after several stores rather than one, that triage list doubles as your prioritisation list. Rank by traffic multiplied by gap-to-target rather than by who emailed you last. The store sitting at 70% on a high-volume collection page deserves three afternoons before the one already at 92%.
Freeze by mid-November. No new apps, no new sections, no quick theme tweaks during the weekend itself. Anything you change after the freeze is something you cannot test under load.
Then watch it live. Not a single lab score in October, but real visitors, split by template and device, while the traffic is arriving. If your product pages start struggling at 12:01 p.m. because an app is buckling, you want to know within ten minutes rather than in the post-mortem. We wrote more about that side of the season in preparing for peak traffic with instant page speed.
Where Uxify comes in
Theme Vitals is the right tool for comparing themes, and we recommend it happily. It is a monthly, theme-level view built on public field data, and it does that job better than anyone.
What it cannot tell you is how your store performs, with your apps and your images, on the templates that actually make you money. Theme-level numbers describe a group of stores that happen to share a theme. Your store is not the average of that group, and November is a bad month to plan as though it is.
Uxify’s Reality captures what your own visitors actually experience, split by template and device, so you can see that your homepage is fine while your product pages are quietly costing you money. It watches every session across every browser, Safari included, which matters given how much of your BFCM traffic will arrive on an iPhone.
From there, Competitors puts your numbers beside the stores you are genuinely losing sales to, which is a far more useful benchmark than a global median. Industry shows where your whole category sits, so you know whether 2.4 seconds is strong for your vertical or merely typical.
And then there are the agents, which act on what Reality finds. INProve keeps interactions instant when your app stack is at its heaviest, which is the ceiling your theme choice sets. Navigation AI prepares the next page before the shopper clicks. And Carter works on the moment that hurts most in November, stepping in when a full cart is about to walk away.
This is not theoretical. Strand runs nearly 80% of its traffic on mobile, and their agency used Reality to find where mobile shoppers were hesitating before layering Navigation AI on top. Form abandonment fell by almost half. No redesign, no theme rebuild, no developer sprint.
The short version
Your discount strategy decides how many people click. Your theme decides how many of them get far enough to buy.
The gap between the best and worst themes in the same Shopify catalogue is more than fifty percentage points. The most popular themes sit nowhere near the top. Interaction speed across the platform has been sliding for six months, driven by what stores install rather than by the platform itself. And all of it is public, free, and about ten minutes of your afternoon.
Ten minutes in September, against a weekend that moved $14.6 billion last year. That maths is not close.

Frequently asked questions
What is a good Core Web Vitals pass rate for a Shopify theme?
90% or higher on mobile for all three Core Web Vitals. The median theme sits at 84.8%, the best at 97.2%, and the weakest with enough stores to report at 43.8%. Below 85%, keep looking.
Which Shopify theme is the fastest?
It changes from month to month, so check the current table rather than a published list. In the August 2026 data the top theme passed all three Core Web Vitals on 97.2% of its stores, against a median of 84.8%. Theme Vitals updates the numbers monthly.
Can apps make a fast Shopify theme slow?
Yes, mainly through interaction speed. App JavaScript competes with the browser’s ability to respond to taps, and Shopify measured roughly a 1.5% conversion drop for every 32 milliseconds of added response time.
Should I change my Shopify theme before Black Friday?
Only if you have more than eight weeks. Inside that window, triage instead: remove unused apps, compress and resize images on your top landing pages, and fix loading priority on your hero images.
Does a good PageSpeed score mean my Shopify theme is fast?
Not necessarily. Lighthouse is a single lab test and can be gamed. Theme Vitals leaves lab scores out of its rankings entirely and uses field data from real Chrome sessions across more than 630,000 stores.